NEB - 99.3
PSU - 95.6
OSU - 94.4
IOWA - 70
ALA - 91.9
So, he didn't have a great game vs Iowa, but according to the ratings, he had better games VS NEB, also vs OSU and PSU when he was playing hurt, than he did vs. Alabama.
That means on average, other teams scored 18 more points than Michigan could against the same opponents.
Not quite. Since you input a 0 when Michigan scored the highest point total of the season against that opponent, you are skewing the average. The conclusion you can draw is that "On average, the highest point total of the season was 18 points higher than Michigan could score." Or you could input a negative number in that spot to account for Michigan outscoring all others against that opponent. In the case of the 1997 team, it was only a single game. Another way to arrive at the delta between Michigan and the toughest opponents would be to average Michigan's point total and average the highest point totals and calculate the delta between those numbers.
Stalions is buying a half-million dollar house on a 55k salary
Why is everyone ignoring the fact that this guy was an O-3 with 5 years in the USMC.
Base pay for an O-3 with four years experience is about $75,000 + $30,000ish BAH. As a single guy with no student loans, I'm sure he could afford to buy a house for $500,000.
Hi Seth! Really dig your analysis. Compiling all of this data and visualizing it is hard work.
I've been playing around with Tableau at home and downloaded your viz to mess with it. Can I humbly recommend a couple of changes to improve your chart?
Add transparent boxplot overlays to emphasize the distribution
Sort your Past/Present/Future metric to put the former players at the back. On your viz we seem to have lost track of the current WRs. I think they are sorted under the former players.
Disperse the color range and sizes more so that it's easier to distinguish between the three categories.
Just some minor changes, but I think they greatly improve the readability of the chart.
It was McSorely that threw the second interception and HOLY JESUS Gary got tackled on the last play of the 6th drive, otherwise he would have sacked McSorely before Glasgow.
More importantly, I always appreciate the UFRs. I've learned so much about football from going through the play by plays and I look forward to them every week. Keep it up!
I felt so strongly about your "moment of zen" that I abandoned my lurker status and created an account.
That video displayed a much larger player lifting and driving a smaller player headfirst into the turf. That play is incredibly risky towards the smaller player's spinal health and carries an increased risk of concussion. Let's not forget that the smaller player in question was his own teammate. In rugby, this play would have likely resulted in a yellow or red card for dangerous play, for good reason.
If we want to take player safety seriously, as fans we do carry some responsibility. I don't think that we should be celebrating dangerous play, especially not when it's carried out in practice against a teammate. Let's do the right thing here gentlemen and ladies.
Recent Comments
How are you determining that?
JJ's QBR in the games I mentioned
NEB - 99.3
PSU - 95.6
OSU - 94.4
IOWA - 70
ALA - 91.9
So, he didn't have a great game vs Iowa, but according to the ratings, he had better games VS NEB, also vs OSU and PSU when he was playing hurt, than he did vs. Alabama.
PFF also agrees that JJ had better games vs NEB, PSU and OSU than vs Alabama:
NEB - 77.6
PSU - 74.4
OSU - 71.9
IOWA - 67.7
ALA - 71.2
To throw out a comparison, JJ had a higher overall grade (90.6) than Patrick Mahomes (90.2) did in his senior year. Do you think Mahomes faced tougher defenses for TTU in 2016 than McCarthy did this year?
How do you rank the following defenses from 2023?
If you go by scoring, it's 2, 3, 4, 16. If you'd rather use SP+ defensive ranking it's, 2, 4, 3, 8. You can also add in Nebraska at 6 in the SP+.
Are you arguing that Michigan's was the only elite defense last year? I don't think that's a fair bar to set.
We won the national championship. What more credit is there even to give?
Quarterbacks throw with their hands. There's only one ball to "feed" to those hands.
That means…
Small nitpick.
Not quite. Since you input a 0 when Michigan scored the highest point total of the season against that opponent, you are skewing the average. The conclusion you can draw is that "On average, the highest point total of the season was 18 points higher than Michigan could score." Or you could input a negative number in that spot to account for Michigan outscoring all others against that opponent. In the case of the 1997 team, it was only a single game. Another way to arrive at the delta between Michigan and the toughest opponents would be to average Michigan's point total and average the highest point totals and calculate the delta between those numbers.
Why is everyone ignoring the fact that this guy was an O-3 with 5 years in the USMC.
Base pay for an O-3 with four years experience is about $75,000 + $30,000ish BAH. As a single guy with no student loans, I'm sure he could afford to buy a house for $500,000.
Clearly I've come to the wrong place. My mistake.
This is embarrassing. Criticize Ryan Day's actions, but don't hurl personal insults. You can be better than this.
Are you twelve? This is shameful.
I am going to print this on a shirt and wear it to the OSU game
> And yet, they moved up.
The team ahead of Ohio State (Texas) lost. Of course they moved up.
Would you move them back? They won by 20 against an undefeated team.
Wow, it's just a population density map. Michigan has an above average population. hmm...
Any mapping nerd will recognize this XKCD.
#15…
#19 Michigan (11-5) vs
#15 Indiana (12-5)
Is this from the first time they played?
One thing…
Cool, looks nice!
One thing though... I did not use red. The color is brown, same color as a football. I thought it fit with the theme. :)
Hi Seth! Really dig your analysis. Compiling all of this data and visualizing it is hard work.
I've been playing around with Tableau at home and downloaded your viz to mess with it. Can I humbly recommend a couple of changes to improve your chart?
Just some minor changes, but I think they greatly improve the readability of the chart.
https://public.tableau.com/shared/57DYWNN36?:display_count=yes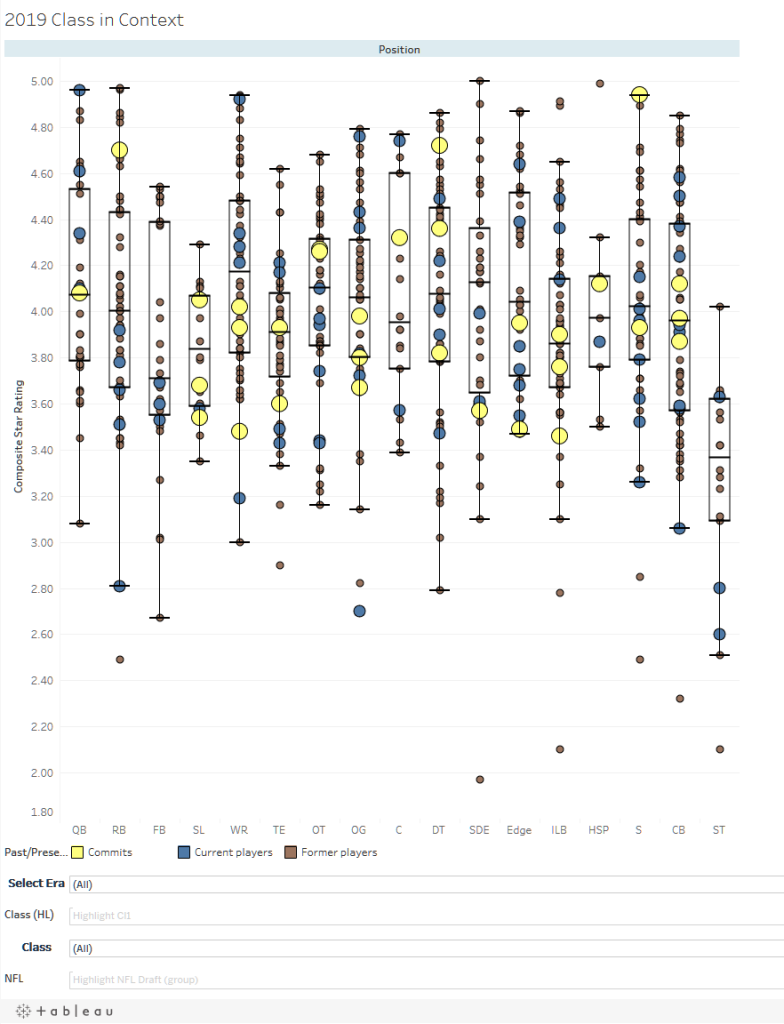
I got heated during the game when #72 jumped on Chase. I feel kind of dirty afterwards seeing him step on #72's ankle prior to that.
Do you think it would be possible to total the dropbacks and calculate a (pass-pro minus/per dropback) statistic?
It was McSorely that threw the second interception and HOLY JESUS Gary got tackled on the last play of the 6th drive, otherwise he would have sacked McSorely before Glasgow.
More importantly, I always appreciate the UFRs. I've learned so much about football from going through the play by plays and I look forward to them every week. Keep it up!
That's what I was thinking...
What do you mean "ceiling will again be limited." They went to the championship game last year.
That camera is the one on top of the backboard, so the shaking is actually the ball going in. I think that makes it cooler...