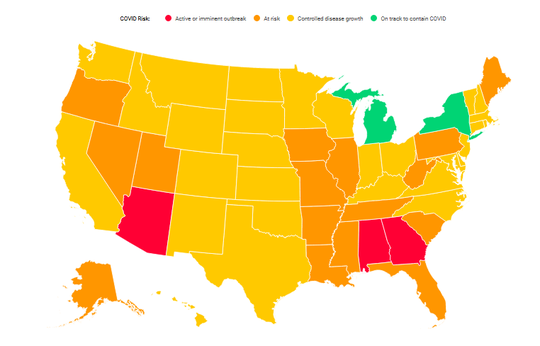
OT: MI is one of 2 states on track to contain COVID

*says a prayer for Rob F*

I mean, now that Riots have somewhat subsided - let's bring back all the unnecessary COVID-19 fear.

The Woman From Michigan and Governor Cuomo for the win.
Wear your masks bitches!
Let's wait and see. I'm sure next Monday new data will be released and Michigan will be the least likely state to contain COVID.
That'd be strange given the 2+ months of data showing otherwise.
Cuomo is responsible for the highest case count and death rate and this is considered a win? What the fuck is happening here?
I'm not saying whether or not I agree with Cuomo's approach, but you're just gonna gloss over the fact that he has the nation's largest and most densely populated city?
I think the argument is that, had Cuomo acted sooner (as some other governors did and DeBlasio wanted), a lot of lives could have been saved.
Maybe true or not, but that seems to be the contention.
I wish this crappy website would alert you when you get a response because I'm sure you'll never see this but, no, I'm not ignoring it....NY has a higher death rate than Spain, Italy and other entire countries in the EU.
Spain has approx. 2x the number people and Madrid is roughly the same population and density as NYC yet it has lower death count as a country. That's crazy.
Maybe if Cuomo hadn't made nursing homes take in C19 patients he wouldn't be leading the US and a few European countries in death count.
But did they really win? They failed worse than all other states (except maybe New Jersey) at initially flattening the curve so yeah they're doing better now but that was to be expected if the curve wasn't flattened as much.
They still have amongst the highest per capita death rates in the country. Michigan is top 5 I think right now in that category. Caveats about reporting methodology apply.
So you're saying the initial outbreak in Detroit was the fault of Michigan's government?
Michigan and NY actually did flatten the curve about as hard as anyone in the US. Just have to look at new cases per day. And for the record, Michigan is 8th in deaths per capita (including DC). But the top 10 were all states hit in that first surge, so of course their current per capita deaths are higher. Just like Italy and Spain with respect to Europe.
https://www.nytimes.com/interactive/2020/us/coronavirus-us-cases.html?action=click&pgtype=Article&state=default&module=styln-coronavirus&variant=show®ion=TOP_BANNER&context=storylines_menu#states
Given the initial outbreak, Michigan has done very well by all metrics including new cases, deaths, effective R0, testing rates, and efforts toward contact tracing.
Michigan is most improved, not MVP. Around the world, sharp rises in COVID were followed by sharp decline regardless of shut down implementation. Starting off with a disaster is hardly a recipe for success.
The disaster isn't the governor's fault except for putting COVID-19 patients in nursing homes but then the recovery cannot attributed to any of the governor's action either.
So Michigan and New York were two of the worst states with Covid in America, so it would seem they would have the largest decline....but I digress....
Go Blue!!
Thought that map highlighted the two states with the worst nursing home policies.
You do realize that many other states were also discharging covid positive patients from hospitals to nursing homes? For instance: Florida
I did. Michigan has obfuscated those stats until yesterday and now that they have released some they look understated at about 1800 (roughly 33 percent of deaths), given that one of the SE Michigan facilities shows 0 deaths, when in fact they have 18.
As do many diseases, covid is particularly deadly for old people. There are lots of old people in nursing homes. Not surprisingly, there have been many deaths in nursing homes. There were clearly policy flaws at both the national and state level that exacerbated this problem. Some happened during the course of covid, some predate it. We can and should do better. It very well may be true in the end that Michigan and New York handled it particularly badly, but that seems far from an established fact.
Fair enough.
All the many people whose relatives died in group home settings because Cuomo ordered them to accept infected people might disagree with your characterization of Cuomo “winning.”
Schools will also re-open this fall for in-person teaching.
But no details or budgeting updates. Hmph.
It’s mid June...
Our fiscal year starts in two weeks. And things take time to plan.
Pay freezes and bad decisions soon to come...
This is why I'm not even trying to apply for Ann Arbor jobs this year. Being the last hired seems like a bad, bad idea given what budgets are going to look like.
I live in California. My fear is that we flattened the curve so much that we’re going to be dealing with Covid for the next decade.
(I’m joking, sort of.)
In the absence of a vaccine, I think you'd be absolutely correct. Hopefully we have one soon so we'll have tons of thousands of lives saved to show for it instead of just a slower burn of the same and result.
RobF. This will be your first true test
On a more serious note, anyone know how reliable this data is? If it is, it would certainly seem to be a large point in favor of more stringent lockdown methods considering Detroit and NYC were both a mess for a while there
The data itself is as reliable as most other sites. I've only had a chance to glance through it, but they have the model available on GitHub along with a document describing their methodology and assumptions, which I'll be looking through later.
From what I can tell, they essentially grading states in 4 areas - growth rate, positive test rate, ICU headroom used, contact tracing - and your state-wide grade is the lowest of those 4. These are comparisons of today's newly reported cases to last week's newly reported cases, the number of tests we are doing, the number of ICU beds we have, and how much capacity we have for contact tracing. All of these things are good things to measure, but I think that they were also affected in states with higher outbreaks. Detroit and NYC outbreaks necessitated that the states do more testing, increase their ICU capacities, and start contact tracing to help drive the rate of spread down further. We're also coming from higher numbers of cases, so we have much more room to decrease our growth than states without outbreaks.
So, while I think these metrics show how well a state is doing at implementing generally accepted best practices (these are basically the numbers I look at each day on michigan.gov/coronavirus), I don't think these metrics will necessarily be accurate in predictions about which states are most likely to contain COVID. They could be, but I think that policy and the public's adherence to the policy plays a large part in driving results and that's not measured well by these metrics. For example, making masks mandatory and the public adhering to that policy will have a larger effect on containing COVID than the number of ICU beds in the state. The effect of those two variables will be shown in the number of newly reported cases, which will affect all of these metrics, so it's not like it's being completely ignored, but that also means that these metrics can fluctuate drastically without further control of these types of variables.
It is also significant that NY and MI were two of the last states to start opening up. They haven’t had as much time to see a rise in new cases.
I do think that NY and MI deserve some credit for setting up contact tracing. Other states that were hard hit did not all meet this metric.
That red for Arizona isn’t because it’s so hot down here.
It's a dry heat.
Humidity
Do wildfires destroy the Covid virus?

If I'm curt, it's because time is a factor. I think fast, I talk fast, and I need you guys to act fast if you're going to get out of this. So pretty please, with sugar on top, clean the fucking car.
That's not a huge surprise considering that New York and Michigan have the first and eighth highest death rate per 1,000,000 residents. It seems the virus mostly ran its course in NY and SE MI. Not sure sticking old people with COVID in nursing homes was the best policy decision.
EDIT to fix state rankings per comment below.
This, exactly. Both states were hammered, and given the education provided by many board members working in the medical field (much appreciated), it would seem the virus probably has a much harder time finding new hosts (if the idea of immunity/not catching it again right away is in fact holding true).
Where is this idea that we might be reaching herd immunity coming from? Every study I've come across has put total percentage of the US population with antibodies at around 5%; studies coming out of the hardest hit region in the country (NYC) indicate perhaps 20-25% with antibodies.
The fact is that we are nowhere close to "herd immunity" and a drop in cases should be attributed much more to social distancing than "fewer hosts."
"Herd immunity" may be at 60% infection levels (the 60% number coming from an estimated R0 of 2.5).
But let's not underestimate just how much even 20% levels can help reduce spread. The NYC numbers in that article are from late April, so they've likely gone up since then.
Rt = the number of people one infected person is likely to infect right now = R0 * (percent of population susceptible at the current time)
If R0 = 2.5 and 0% are immune, 1 person infects 2.5 people, who then infect 6.25 people, etc. After 10 cycles, that is 15,894 people infected in aggregate.
If R0 = 2.5 and 20% are immune however, 1 person infects 2 people, who then infect 4 people, etc. After 10 cycles, that is 2,047 people infected in aggregate.
That is a BIG difference. Different by a factor of 7x+.
yes we are herd immuned.
Michigan is actually 7th in death rate by state (8th if you include DC). So, yes Michigan was hit very hard by COVID-19, I don't see how that diminishes the fact that it is now performing much better. Louisiana and most of the tri-state area have higher death rates and are not performing as well, and it will be interesting to see by this time next year if Michigan's results look quite as bad compared to Florida, Arizona, Texas, etc.
You're right about the ranking, I was looking at an incomplete chart earlier. Michigan does have the second-highest confirmed case fatality rate (CT).
My point is that places that appear to have better contained the virus are also some of the hardest hit places to date. To me that makes sense, but I'm no expert.
Where are you getting that Michigan has the third highest death rate? On worldmeters they are 7th or 8th (depending on whether you include DC). NY, NJ, CT and RI are all over 1000 deaths per million and MI is at about 600.
It's almost like listening to public health experts results in better public health outcomes.
I'm glad the numbers look good. Also, the gym needs to open back up.
“Not if I can help it!!!”
- Dale from Downriver, who just wants a haircut and a new Confederate flag t-shirt.
Why isn't everyone in Wisconsin dead?
One word: Cheese