Some Michigan Basketball Graphs

Derrick Walton has stepped up in the latter half of B1G play [Bryan Fuller]
If you’re looking for Ace’s preview of tomorrow’s contest against Purdue, it’s linked here.
As an addendum to that, here’s how dominant Boilermaker big man and probable All-American Caleb Swanigan is on the glass:
Fortunately Michigan is indifferent to the offensive glass so Swanigan’s dominance in preventing second-chance opportunities isn’t quite as significant; still, he’s a phenomenal rebounder even though he’s not much of an above the rim player. His strength, positioning, and ability to go get the ball (even without a great vertical leap) is impressive to watch.
Swanigan’s player comparisons are pretty insane as well:
Swanigan is a Jared Sullinger who’s 30 pounds lighter, can pass the ball extremely well, and shoots 47% from three. Needless to say, Michigan needs DJ Wilson (and Moritz Wagner, probably) to somehow neutralize him – the Purdue big man is a much more physical player, so staying out of foul trouble is a major key.
Anyways, there are some graphs of Michigan’s scoring and efficiency trends after the JUMP:
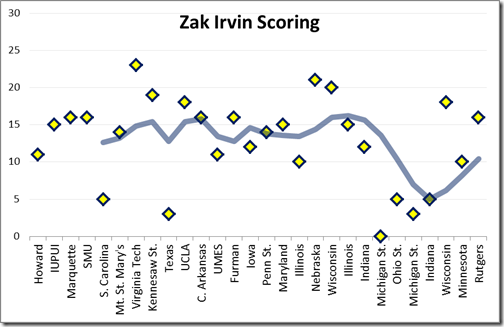
Lines are 5-game running averages
Michigan is a team with very little depth: eight players play rotation minutes and two – Xavier Simpson and Mark Donnal – are mostly invisible on offense and typically don’t play significant minutes unless there’s foul trouble of some kind. There are six players who collectively produce Michigan’s scoring output, and there’s quite a bit of balance between them.
Here are the scoring averages for those six players:
- Derrick Walton: 14.3 points per game
- Zak Irvin: 12.8 points per game
- Moritz Wagner: 12.2 points per game
- DJ Wilson: 10.4 points per game
- Muhammad-Ali Abdur-Rahkman: 8.9 points per game
- Duncan Robinson: 8.1 points per game
Until Walton’s recent run of excellent form, Michigan never had a player who’d go for more than 17 points per game over a 5-game stretch. This balance is a strength in some ways – as a poor performance or two from among the six key contributors isn’t catastrophic – but the Wolverines’ lack of a go-to guy has been a well-documented concern. Hopefully Walton can be that clear first option as the season draws to a close.
The two most interesting scoring trends are from Michigan’s two senior leaders, Derrick Walton and Zak Irvin. Our slack thread put it well:
Irvin scored in double digits in 19 of his first 21 games – aside from notable clunkers against South Carolina (in which the whole team shot poorly) and Texas (the ugliest game Michigan will have played all season), he was the mark of consistency in terms of scoring output. As the least efficient member of Michigan’s six-man core, it sometimes took too many shots for him to get those points, but Irvin was a stable source of points for most of the season.
He seems to have recovered from the huge dip in production after putting up 18 and 16 points in wins against Wisconsin and Rutgers, but that slide was severe: over four games, Irvin scored 13 points on 33 shot equivalents – amazingly poor numbers. Fortunately for Michigan, Derrick Walton’s emergence as a strong scorer helped mitigate the damage and the Wolverines somehow went 2-2 in those games.
While he’s come to earth recently, Walton’s February surge will likely have been the deciding factor in getting Michigan into the NCAA Tournament (if they make it). In five of the seven games immediately following the “white collar” comment, Walton scored at least 20 points. Even though he fell off quite a bit against Wisconsin in terms of scoring, he still added eight assists in arguably Michigan’s biggest game of the season. At this point, it’s hard to argue that he isn’t the best player on the team.
* * *
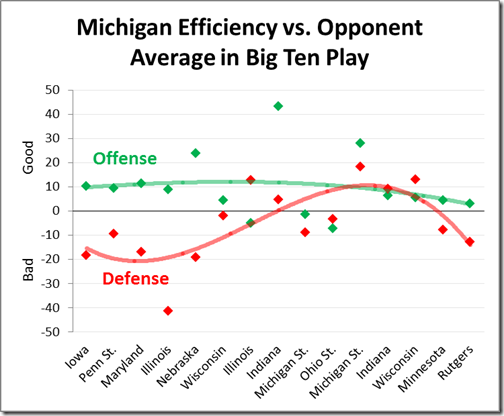
Data points are (Offensive Efficiency – Opponent Average Defensive Efficiency in B1G Games) and (Opponent Average Offensive Efficiency in B1G Games – Defensive Efficiency) for the given games. The lines are 3rd-degree polynomial trends.
Michigan is a team of extremes: their offense is the best in the Big Ten and their defense is the third-worst in the conference. Early on in conference play especially, the Wolverines struggled to get stops and lost four of their first six league games, allowing more points per possession than their opponents’ averages in each of those contests. They had five of their six worst performances to open conference play. An unsustainably high opponent 3-point rate was a big part of that, but it was abundantly clear that the Wolverines needed plenty of work on that end.
Since the Nebraska game, the defense has been mostly solid – though the two most recent games against Minnesota and Rutgers are troubling. The Wolverines undeniably improved on the defensive end in the middle third of conference play, even to the point where they were playing above-average defense for a Big Ten team for a little while. In the critical three-game winning streak of Michigan State, @ Indiana, and Wisconsin, Michigan had a better defensive performance than they did on offense in two of the three wins.
Michigan still allows the worst opponent eFG% in the league by a wide margin, though they’re average or slightly better in each of the other four factors on that side of the floor (turnover %, defensive rebounding %, and opponent free throw rate). Assuming that the Minnesota and Rutgers games aren’t the start of a worrying slide – and considering that they only gave up 1.11 and 1.01 points per possession in those games, it’s not too alarming – it’s possible to conclude that the defense really has significantly improved for the Wolverines.
The offense has been remarkably consistent throughout conference play, as Michigan scored fewer points per possession relative to their opponent average just three times in fifteen games. Aside from especially strong performances at home against Nebraska, Indiana, and Michigan State, they’ve been between about 0.10 points per possession better or 0.05 points per possession worse than their opponent averages – on aggregate, good enough to be the conference’s best offense. Avoiding any truly bad offensive performances has been key with an iffy defense.
February 24th, 2017 at 5:32 PM ^
If they can play good defense in these next few games, I think they punch their ticket.
February 24th, 2017 at 5:58 PM ^
Imagine if Walton and Irvin could get it going at the same time.
February 24th, 2017 at 6:17 PM ^
the offensive consistency. In any discussion about the teams "schizophrenic" nature this year, the narrative inevitibly devolves to "well, that's what happens when you're a jump shooting team that relies heavily on threes" when, in fact, the offense has been incredibly consistent. It'd be interesting to see an analysis on the variance of offensive efficiency from game-to-game. I bet we're near the top nationally for consistency. And it can be attributed to the balance. Since we don't rely heavily on one guy, but have six good offensive players, it's almost a given that 3-4 will have a good game, and 2-3 will have a meh to bad game and it'll come out good overall.
It's been our defense that is unusually inconsistent: excellent early in the year, abysmal starting with UCLA through Nebraska (aided by bad luck on threes), and then pretty good again. I'm not very worried about Minnesota (heavily ref aided) or Rutgers (I mean, it's 1 ppp in a game in which we rebounded pretty well - they just made more 3s and FTs than expected and those are mostly defense agnostic shots).
February 24th, 2017 at 8:20 PM ^
Tom Izzo must stay up at night thinking about Swanigan decommitting from MSU.
February 24th, 2017 at 8:30 PM ^
February 25th, 2017 at 12:11 AM ^
is included in these defensive stats. You're right that it has been a big contributor to our defensive inconsistency (along with opponent 3pt percentage).
Definitley need to get the FTs under control, but I'm not worried about that. That is something we are VERY good at.
February 24th, 2017 at 10:57 PM ^
February 25th, 2017 at 9:56 AM ^
February 25th, 2017 at 11:32 AM ^
We haven't had much rest lately. Hopefully he has his legs today.
February 25th, 2017 at 11:05 AM ^
I haven't seen Purdue much recently--is Swanigan the remix of Boogie Cousins?
February 25th, 2017 at 3:14 PM ^
He's shorter and wider than Boogie so isn't a shot blocker or as good of a defender as Boogie was. Much better shooter from FT and 3pt though.
So much closer to Jared Sullinger.


Comments