
Jimmystats: Things We Learned from UFR 2021: Defense

I put all the UFR charting from this year into a single spreadsheet. Many Pivot Tables later there are things we can see.
4-3 versus 5-2: Fight!
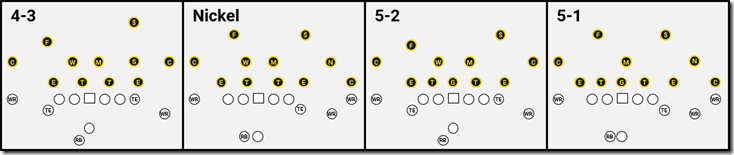
The first thing I looked at was how often Michigan was in each of their usual personnel groups. The exact personnel was subject to change, but generally if they were in a 4-3 it was Michael Barrett playing the SAM, and both Ojabo and Hutchinson were on the field; if they were in a 5-2 they would have Jaylen Harrell out there as a hybrid DE/OLB instead of Ojabo, and one or two of Morris, Jenkins, and Welschof on the field.
As you might expect, defensive personnel was highly reactive to what personnel the offense was using, though not precisely. Michigan treated extra running backs (but not fullbacks) as wide receivers, so that’s how I counted 2RB sets.
| Off Personnel | Nickel | 5-2 | 4-3 | 5-1 | Exotic | Total |
|---|---|---|---|---|---|---|
| 3 WRs or more | 87% | 4% | 4% | 2% | 2% | 578 |
| 2 WRs or fewer | 22% | 47% | 21% | 3% | 3% | 328 |
| All plays | 574 | 179 | 90 | 40 | 23 | 906 |
Down and distance mattered too; usually if Michigan was in a nickel set versus multiple tight ends it was a passing down. But whether they broke out the 5-1, or if they used a 5-2 versus a 4-3 against multiple TE sets often depended most on what part of the season we’re talking about. Here’s a breakdown by game:
| Opponent | Nickel | 5-2 | 4-3 | 5-1 | Exotic | Total |
|---|---|---|---|---|---|---|
| Western Michigan | 40 | 4 | 1 | 4 | 2 | 51 |
| Washington | 39 | 24 | 5 | 5 | 73 | |
| Northern Illinois | 19 | 15 | 2 | 2 | 38 | |
| Rutgers | 56 | 19 | 75 | |||
| Wisconsin | 21 | 17 | 14 | 52 | ||
| Nebraska | 52 | 7 | 2 | 3 | 64 | |
| Northwestern | 30 | 9 | 6 | 45 | ||
| Michigan State | 40 | 19 | 6 | 7 | 72 | |
| Indiana | 13 | 45 | 58 | |||
| Penn State | 61 | 1 | 24 | 86 | ||
| Maryland | 61 | 4 | 4 | 69 | ||
| Ohio State | 82 | 2 | 2 | 86 | ||
| Iowa | 32 | 30 | 6 | 68 | ||
| Georgia | 28 | 28 | 10 | 1 | 2 | 69 |
| 2021 Totals | 63% | 20% | 10% | 4% | 3% | 906 |
That tells a story: when they faced heavier sets, Michigan was a 5-2 team through MSU, a 4-3 team for two games, then a mix the rest of the way. In the games they used both the only pattern I thought I could see is they seemed to run with whichever was working until it didn’t.
In the Defense vs Georgia UFR I asserted that I liked the 4-3 (with Barrett as a hybrid S/LB) better than the 5-2 as a response to multi-TE personnel. With sampling error warnings abound, that bore out in the statistics:
| TOTAL | Standard Downs | Passing Downs | |||||||||
|---|---|---|---|---|---|---|---|---|---|---|---|
| DPack | Plays | YPP | EPA | Plays | YPP | EPA | Plays | YPP | EPA | ||
| Nickel | 574 | 4.7 | -0.02 | 323 | 5.0 | -0.01 | 251 | 4.4 | -0.02 | ||
| 5-2 | 179 | 4.7 | -0.12 | 144 | 5.2 | -0.13 | 35 | 3.0 | -0.10 | ||
| 4-3 | 90 | 3.5 | -0.22 | 61 | 3.8 | -0.05 | 29 | 2.8 | -0.57 | ||
| 5-1 Nk | 40 | 5.8 | 0.36 | 29 | 3.4 | 0.23 | 11 | 15.3 | 0.70 | ||
| Exotic | 23 | 5.8 | 0.34 | 16 | 3.8 | 0.34 | 7 | 9.2 | 0.35 | ||
The 5-1 worked against Wisconsin and emphatically did not against Michigan State. We discussed it at the time, but I thought that too was a tactical blunder. The idea was to clog up zone running lanes at the line of scrimmage at the risk of allowing a few bigger chunks if the runner made it through.
Think of it in battle terms: if you put 5 units at the front with one in reserve, there are fewer places they can break through, but you’re less able to react when they do so. If you put 4 units at the front and hold two in reserve, you’re less likely to stonewall them, but can be more reactive. Terrain or defensive obstacles can make a lot of these decisions for you, especially if stopping the enemy’s momentum for a moment will screw up their whole offensive. The enemy’s deployment matters too; if they’re probing the line for weaknesses you don’t want to give them any, whereas if they’re hitting one spot in force you’d like to have to agility to react to where it hits.
Going heavy at the front is a good tactic you’re facing a good stretch zone (probing for weaknesses, the run play) offense, a 5-man front can frustrate them. Heavy fronts are also effective against a team that’s guaranteed to move the ball on 3rd and 2 but can’t pass out of a 2nd and 8. The tactic worked perfectly for Wisconsin, since passing downs were death. Against MSU it backfired; State got away with an excessive amount of holding, which meant they were winning those battles up front more often than they should have been, and then there was nobody to stop Kenneth Walker III.
Michigan scrapped the five-man lines after the MSU game, in part because they realized they had two 4-3ish DEs they wanted on the field in David Ojabo and Aidan Hutchinson, but also I think because Michael Barrett was available again. Barrett was an every-down hybrid LB for Indiana, and since the rest of the schedule was spread teams Michigan barely touched the 5-2 again until the postseason. It did its job in the Big Ten CG, frustrating the Hawkeyes’ plans to stretch zone Michigan to death. But the 5-2 was beat up pretty badly by Georgia, which was able to take advantage of the Harrell-vs-Brock Bowers and 5-star OTs versus Julius Welschof mismatches.
------------------------------
EPA and You
(Apologies in this section for anyone whose job involves federal politics or pollution control for using “EPA” for something other than federal agency. I used to be the publisher of a trade magazine for professionals who have to deal with environmental regulations, so it’s weird for me too.)
I tracked Expected Points Added across the season. This is a calculation based on game state for every play. The gist of it is you can calculate the value of any given play by knowing the average points a CFB team will score from that down, distance, and field position. So for example teams with a 1st and 10 on their own 25-yard line will score an average of .922 points that drive.
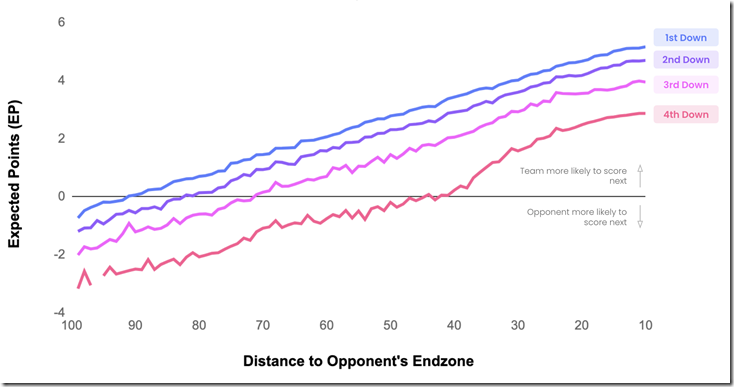
Teams with 2nd and 10 on the 25 will average about 0.219 points (considering turnovers and punts convert into expected points for the other team). The difference between .922 and 0.219 is –0.703, ergo the expected points added from an incomplete pass on 1st and 10 from the 25 is –0.703. It’s not by any means perfect, especially when we get into game states with low sample sizes. It also doesn’t factor in time. And it gets really hairy when I try to apply it to players. It’s best for showing game to game data, and as a check against yards per play, because YPP doesn’t distinguish between an incomplete on 1st and 10 and zero yards on 4th and 1.
Here’s the season data (remember, for the defense negative is good); the total can be interpreted as the total contribution to the final margin from the performance of Michigan’s defense versus that opponent’s offense.
| Opponent | Plays | AvgYds | AvgEPA | Total |
|---|---|---|---|---|
| Western Michigan | 50 | 4.2 | +0.10 | +5.1 |
| Washington | 73 | 4.6 | -0.05 | -3.8 |
| Northern Illinois | 38 | 2.4 | -0.40 | -15.1 |
| Rutgers | 75 | 4.7 | -0.05 | -3.7 |
| Wisconsin | 52 | 2.9 | -0.24 | -12.5 |
| Nebraska | 64 | 6.9 | +0.04 | +2.8 |
| Northwestern | 45 | 4.2 | -0.26 | -11.5 |
| Michigan State | 72 | 5.8 | +0.26 | +18.6 |
| Indiana | 58 | 3.2 | -0.17 | -9.6 |
| Penn State | 86 | 3.8 | -0.16 | -13.8 |
| Maryland | 69 | 4.2 | -0.15 | -10.2 |
| Ohio State | 85 | 4.8 | +0.10 | +8.5 |
| Iowa | 68 | 3.8 | -0.21 | -14.0 |
| Georgia | 69 | 7.2 | +0.38 | +25.9 |
I highlighted the rougher outings because it was interesting to me to see where our standard tempo-free metric, yards per play, spit out a different result from the EPA. The Georgia game was the worst, no question. But the defense gave up nearly as many yards per play to Nebraska without giving up a lot of expected points. The EPA totals pass the eye test for me.
And here’s that broken down by play-calling:
| Type | Plays | AvgYds | AvgEPA |
|---|---|---|---|
| Pass | 398 | 4.9 | -0.08 |
| Play-Action | 91 | 7.5 | 0.31 |
| RPO | 68 | 3.8 | 0.01 |
| Rush | 329 | 4.1 | -0.06 |
| No Play | 18 | -4.4 | -0.52 |
“No play” means there was a pre-snap penalty, like offsides with contact or a false start; if I can put it in the other boxes I will.
Putting up a negative in any of these categories is excellent, and you can see that Michigan was stout against the run and gave up even less on drop-back passing plays. Then there’s play-action. To put +0.31 in perspective, that’s like a 7-yard play on 1st and 10. Their average defensive play against Georgia was +0.38. It’s not good.
Glancing through those 91 plays, they were fairly evenly distributed between opponents, so it’s not a case of sampling error. Instead I think it demonstrates a real weakness of the team this year in their linebacker play, though they weren’t alone. I have the player targeted for each of those, and while we’re getting into tiny sample sizes, you can see where the issues lay:
| Player | Plays | EPA |
|---|---|---|
| Linemen | 24 | -0.21 |
| Hill | 11 | 0.33 |
| Ross | 9 | 0.49 |
| NHG | 9 | 1.00 |
| Turner | 8 | -0.02 |
| Gray | 8 | 0.82 |
| Green | 7 | 0.76 |
| Hawkins | 4 | 0.46 |
| Colson | 3 | -0.16 |
| Moten | 3 | 1.03 |
| Barrett | 3 | 0.19 |
| Harrell | 2 | -0.25 |
| Total | 91 | 0.31 |
Hill-Green was Michigan’s best linebacker to my grading, but you can see why he wasn’t on the field. RJ Moten also a lot of issues on play-action plays. Ross was picked on a bunch—his calculation includes a jailbreak screen that he played well for a 7-yard loss, but also a Nebraska pass that was going to get a devastating chunk if Mike Morris didn’t bat it down.
Outside Zone Issues
The other play that I found in the EPA data which seemed to give Michigan fits was stretch zone. The two worst (don’t click on those ) plays Michigan gave up all season were outside zones. All told I found 50 instances of some variant of outside or stretch zone, which is roughly equivalent to a game’s worth of running plays. Those plays averaged 0.14 EPA and 6.18 yards. I can search that set of plays the same way I would for the charts and see who was responsible:
UFR CHARTING ON STRETCH ZONES, 2021
| Player | + | - | Total |
|---|---|---|---|
| Hutchinson | 12.5 | 0.5 | +12 |
| Smith | 11 | 3 | +8 |
| Ojabo | 14 | 6.5 | +7.5 |
| Hinton | 9.5 | 3 | +6.5 |
| Jenkins | 5.5 | 3 | +2.5 |
| Ross | 11 | 9 | +2 |
| Jeter | 4.5 | 3 | +1.5 |
| Welschof | 4 | 2.5 | +1.5 |
| Morris | 3 | 3 | 0 |
| Hawkins | 4.5 | 5.5 | -1 |
| Colson | 5 | 12 | -7 |
Remember, UFR charting wants defensive linemen to be making plays, so a zero is not very good. The story this tells is that Ojabo got a lot better at stretch zone defense over the course of the season, the backup DTs had too many mistakes, Ross was very hit or miss, and Colson going in the wrong gap was a constant issue. Hawkins is on there because Michigan played a lot of Cover 2, putting them down a man in the box against the run.
Like the defense as a whole, Michigan’s stretch zone defense could use a lot of improvement in general, and should get some from Colson’s maturation and more talent in the secondary, but also replaces a ton on the defensive line.
How Did Teams Attack Us?
The way I charted isn’t great for breaking down most play calls, especially in passing, because often I end up only seeing the route, not the combination. The list of things we have called plays is up to 1140 after this year. I’ve grouped the run types as best I can, with the number of plays that were the result of zone reads in parentheses.
| Opponent | I.Zone | Power | Stretch | Sweep | QB Run | Tr Opt | Draw | Total |
|---|---|---|---|---|---|---|---|---|
| Western Michigan | 19(5) | 3 | 22(5) | |||||
| Washington | 9(2) | 10 | 5 | 1 | 25(2) | |||
| Northern Illinois | 10 | 9 | 2 | 1 | 22 | |||
| Rutgers | 7(6) | 17(3) | 8(5) | 6(2) | 38(16) | |||
| Wisconsin | 4(1) | 14(2) | 4(3) | 1 | 23(6) | |||
| Nebraska | 8(5) | 11(4) | 1 | 2 | 3(1) | 4(4) | 29(14) | |
| Northwestern | 3(1) | 4 | 1(1) | 3 | 11(2) | |||
| Michigan State | 10(3) | 12(5) | 5 | 3(1) | 30(9) | |||
| Indiana | 12(5) | 4(3) | 3(3) | 2 | 8 | 29(11) | ||
| Penn State | 15(7) | 7 | 1(1) | 4 | 2 | 29(8) | ||
| Maryland | 11(3) | 10(1) | 7 | 3(1) | 3 | 34(5) | ||
| Ohio State | 8 | 2 | 12 | 1 | 23 | |||
| Iowa | 8 | 3 | 12 | 3 | 1 | 27 | ||
| Georgia | 18(2) | 6(1) | 2 | 7 | 33(3) | |||
| Total | 139(40) | 112(19) | 50(8) | 40(6) | 25(4) | 4(4) | 2 | 379(81) |
Obviously style choices have a lot to do with the opponent, but teams that don’t normally run a lot of stretch like Indiana, Maryland and Ohio State put in a lot more than usual after the Michigan State game.
I also noticed the QB reads started to disappear. Something I noted in the early season UFRs was that Michigan’s defense was set up to take away the QB keep and battle it out inside. Only four QB keeps on options on the season is pretty incredible. As for what worked, that had a lot to do with the opponent, but in general stretch zones were the only weakness that stood out. In these small sample sizes one big play can change a lot, e.g. Northwestern got a TD on their one stretch play at the end of the first half.
UFR Totals?
Of course I played around with those breakdowns to see how individual players did against the different types of plays. Some things popped out that went “yeah, that makes sense,” for example the starting DTs did very well (+23/–7 = +16 for Hinton, +24/–9.5 = +14.5 for Smith) against Power rushes while the lighter DTs struggled.
We’ll go through them as totals, but remember, UFR data isn’t supposed to be used this way since there are big sampling errors all over this. But some truths did seem to pop from these numbers that jive with my general takes on these players over the course of the season.
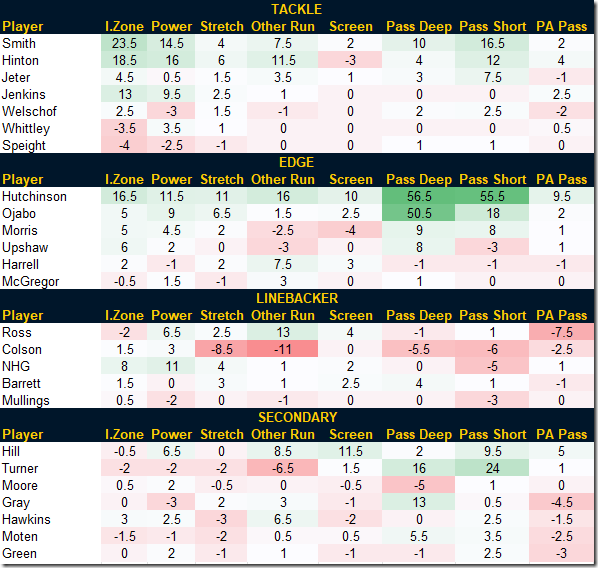
As useful as those colors are, the amplitude matters a great deal. Here’s the charting totals, broken down by position:
TACKLE:
| Player | I.Zone | Power | Stretch | Other Run | Screen | Pass Deep | Pass Short | PA Pass | TOTAL |
|---|---|---|---|---|---|---|---|---|---|
| Smith | +40/-17 | +24/-9 | +8/-4 | +11/-3 | +5/-3 | +11/-1 | +17/-1 | +2/-0 | 80 |
| Hinton | +29/-11 | +23/-7 | +9/-3 | +12/-1 | +1/-4 | +4/-0 | +12/-0 | +5/-1 | 69 |
| Jeter | +16/-12 | +9/-9 | +6/-5 | +3/-0 | +1/-0 | +5/-2 | +8/-1 | +0/-1 | 20.5 |
| Jenkins | +19/-6 | +16/-7 | +5/-3 | +2/-1 | +0/-0 | +0/-0 | +0/-0 | +3/-0 | 28.5 |
| Welschof | +5/-3 | +2/-5 | +4/-2 | +1/-2 | +0/-0 | +2/-0 | +2/-0 | +1/-3 | 2.5 |
| Whittley | +0/-3 | +3/-0 | +1/-0 | +0/-0 | +0/-0 | +0/-0 | +0/-0 | +0/-0 | 1.5 |
| Speight | +2/-6 | +1/-3 | +1/-2 | +1/-1 | +0/-0 | +1/-0 | +1/-0 | +0/-0 | -5.5 |
- Smith: All-around good DL, bent pockets.
- Hinton: Not much pass rush, but good tackle on standard downs, very hard to fool.
- Jeter: Length served vs zone, too moveable to be a power DT, underrated rusher.
- Jenkins: Used mostly as a run-stopper in 5-2 sets. Very effective in that role.
- Welschof: Pass-rushing DT basically.
- Whittley: Barely used.
- Speight: Walk-on’d.
EDGE:
| Player | I.Zone | Power | Stretch | Other Run | Screen | Pass Deep | Pass Short | PA Pass | TOTAL |
|---|---|---|---|---|---|---|---|---|---|
| Hutchinson | +22/-5 | +17/-5 | +11/-0 | +18/-2 | +11/-1 | +57/-1 | +60/-5 | +14/-4 | 186.5 |
| Ojabo | +12/-7 | +13/-4 | +14/-7 | +5/-4 | +4/-2 | +57/-7 | +23/-5 | +3/-1 | 95 |
| Morris | +10/-5 | +6/-2 | +5/-3 | +4/-6 | +1/-5 | +12/-3 | +10/-2 | +1/-0 | 23 |
| Upshaw | +6/-0 | +3/-1 | +0/-0 | +0/-3 | +2/-2 | +9/-1 | +5/-8 | +1/-0 | 11 |
| Harrell | +3/-1 | +5/-6 | +2/-0 | +8/-0 | +3/-0 | +1/-2 | +2/-3 | +4/-5 | 10.5 |
| McGregor | +0/-1 | +2/-1 | +0/-1 | +3/-0 | - | +1/-0 | +2/-2 | - | 4 |
- Hutchinson: Dominant in all facets, constant source of pressure on any pass attempts (generated a lot of throwaways on short passes).
- Ojabo: Unstoppable pass-rusher given enough time. Solid in the other phases, got really good at edge-setting later in the year.
- Morris: Youth showed, didn’t have a lot of pass rush but isn’t just a tackle out there.
- Upshaw: Not effective rushing—that number should never be negative.
- Harrell: Neat weapon, broke some things opponents wanted to do, has zero pass rush.
- McGregor: Has pass rush, a long way to go in the run department.
LINEBACKER:
| Player | I.Zone | Power | Stretch | Other Run | Screen | Pass Deep | Pass Short | PA Pass | TOTAL |
|---|---|---|---|---|---|---|---|---|---|
| Ross | +25/-27 | +30/-23 | +11/-8 | +20/-7 | +10/-6 | +13/-14 | +23/-22 | +5/-12 | 16.5 |
| Colson | +13/-11 | +15/-12 | +3/-12 | +5/-16 | +6/-6 | +3/-9 | +12/-18 | +4/-7 | -29 |
| NHG | +17/-9 | +14/-3 | +7/-3 | +7/-6 | +2/-0 | +2/-2 | +5/-10 | +5/-4 | 22 |
| Barrett | +2/-0 | +1/-1 | +3/-0 | +5/-4 | +4/-1 | +4/-0 | +3/-2 | +2/-3 | 12 |
| Mullings | +1/-0 | +2/-4 | - | +3/-4 | - | - | +0/-3 | - | -5.5 |
- Ross: Fits the player I think we saw all year. There’s that play-action passing negative, and there too is the senior who dealt well with college crappe and excelled when there was a puller telling him where to hit.
- Colson: That’s some freshman right there. Came out slightly positive on the things that happen the most, was the biggest issue with their stretch defense and learned pass defense as he went.
- Hill-Green: You can see the player in there. He mostly diagnosed where to go and stuck his nose in, had some issues when he got it wrong.
- Barrett: Specialty weapon.
- Mullings: Eventful in limited run.
SECONDARY:
| Player | I.Zone | Power | Stretch | Other Run | Screen | Pass Deep | Pass Short | PA Pass | TOTAL |
|---|---|---|---|---|---|---|---|---|---|
| Hill | +4/-4 | +11/-5 | +1/-1 | +14/-6 | +20/-9 | +16/-14 | +27/-17 | +14/-9 | 42.5 |
| Turner | +1/-3 | +0/-2 | +0/-2 | +2/-8 | +6/-4 | +25/-9 | +34/-10 | +4/-3 | 30 |
| Moore | +3/-3 | +3/-1 | - | - | +2/-2 | +0/-5 | +8/-7 | - | -2 |
| Gray | +2/-2 | +0/-3 | +2/-0 | +7/-4 | +5/-6 | +24/-11 | +22/-21 | +3/-7 | 10 |
| Hawkins | +13/-10 | +6/-3 | +3/-6 | +9/-3 | +3/-5 | +10/-10 | +8/-5 | +1/-3 | 8 |
| Moten | +2/-4 | +4/-5 | +1/-3 | +4/-4 | +4/-4 | +9/-4 | +7/-4 | +1/-3 | 3 |
| Green | +1/-1 | +3/-1 | +0/-1 | +2/-1 | +3/-4 | +10/-11 | +10/-7 | +3/-6 | -0.5 |
- Dax: Lol at anyone saying he wasn’t great in college. Ruined WR screens and trick plays. Going to be missed.
- DJ Turner II: Came along over the year as a run defender, star in coverage.
- Moore: Good freshman debut, freshman coverage breakdowns were forgivable but added up.
- Gray: Strong against the run for a CB. Sat back to play the deep ball, exploited underneath, avoided his MSU 2020-style fritz-outs until Georgia.
- Hawkins: In the end, he was boring. Going to miss that a lot.
- Moten: Wasn’t boring, but was so solid in coverage you can feel pretty confident about him next year.
- Green: Remember I gave him a lot of credit for being there to contest jump balls that the receiver brought in. He had issues in zone coverage, and was usually in phase in man.
Guys, I hope you realize that is a pic of Mike Sainristil with Hutchinson
Shit. Leaving it.
It makes perfect sense to me. That’s this year’s All-American defensive superstar on the right and next year’s on the left.
Excellent stuff.
Given the quality of OSU offense, +8.5 EPA allowed is a damn good number, in my opinion.
Still boggles the mind that if they paid one iota of attention to defense, they easily could've been national champs.
The amount of holding (and also pushing defenders from behind) that MSU does seems like it's far too much to just be just player initiated. Are these techniques taught by the coaches?
Yes. Michigan State's OL coaching is a complete joke, and their scouting is worse, so the only way they know to be competitive is take advantage of the fact that Big Ten officiating is even more incompetent than they are.
This isn't coming from rivalry. I know a parent of one of their OL, and I know a lot of local coaches, plus I've been watching as closely as anybody for years. The kids aren't bad people, with a few exceptions. But some of the senior leadership has also been atrocious, and a lot of the "Let's be the biggest cheaters" stuff comes from them more than the coaches.
Thank Seth. Seems like the philosophy of playing to the edge of the rules (and beyond) permeates the entire MSU athletic department.
Super-insightful - thank you.
I keep thinking the same thing every time I read Seth's evaluations of the defense: Hutchinson's departure might single-handedly cause the defense to yield an extra 14 points per game, or something of that order. He was a once-in-a-generation defensive player for any college football team other than Alabama: freak talent with 100% effort on every play. And then you have to factor in his leadership impact other players. Plus we have 2020's results as evidence of what the defense looks like without him.
I can easily see the offense being better next year, but if the defense is regressing this much (and with the added departures of Ojabo, Hinton and Hill, that seems likely), seems like a stretch to think the team will be anywhere near as good as last year's. I hope I'm wrong.
A 14 point deterioration in scoring defense from 2021? Michigan opponents (including playoffs) averaged 17.4 points per game last year - that's going to 31 in 2022?
Gave up 34.5 per game in 2020, the last time Hutchinson wasn’t playing, so it would be an improvement over that
That's also Don Brown vs. Mike Macdonald (and now MM 2.0, Jesse Minter). When you have a player like that, you can scheme around him. Now, the schemes will look slightly different to account for it I'm sure. The production might suffer, but I think 14 points is a big reach. Maybe 3-7 points.
Awesome analysis. If Bo had this type of analysis, and adjusted, well maybe . . . hopefully the Michigan defensive brain trust will make adjustments. Love this type of data! Many thanks for the hard work.
This idea of "if only Bo did analytics" got me thinking:
What was the 1st team that really dispensed with the old school idea of "We're gonna do what we do, you do what you do - let's see who wins!"
I'm of an age to recall several Rose Bowl losses during the 10-Year War era, including to a Stanford team I couldn't name a single player from.
But by and large my impression of the 1st team that just constantly looked to exploit mismatches & inefficiencies was Bill Walsh's 49ers, with Montana & Lott et al. They ran when running was there, but they functionally used short, quick passes as a substitute for the running game for the most part. And when teams brought more help into the scrimmage area - The Catch & Jerry Frickin Rice resulted! Oh, and Roger Craig becoming the 1st player to both rush & receive for over 1K yds in a season!
Flash forward 40 years and Baseball is debating banning the shift, has already limited pitching changes. Everything is analytics now!
BTW, on eliminating the shift. I think that's a total mistake. The analytics say it's the right thing to do and as players were not exposed to it until relatively recently, developing players haven't yet adjusted.
Remember when there was no 3 point line and Bobby Knight thought it would ruin the game? Now, we can't imagine the game without it and it helped to create players like Stephen Curry. Back in the 50s, the bunt single helped Mickey Mantle win the triple crown in 1956, and that was before the shift. If teams continue to shift, there will be players that will learn to exploit it with the bunt single and hit for power and then the best batters will be in the majors rather than just the sluggers.
Love the data Seth! Quick quibble, on the last chart of the secondary, it looks like Moore's numbers could be added in. Was curious to see how his numbers stacked up, given he'll be a big contributor next year.
Added. I had a hidden row for some reason on my spreadsheet. I think that was from me hiding a seldom-used DB and then when the chart moved up a row it hid Moore instead.
Mind-boggling breakdown of the year.
Educational and informative.
Great data analysis! Thank you
So excited to read this.
Comments