B1G Expectations - 2018 Pre-Season

 Expectations - 2018 Pre-Season
“Suffering has been stronger than all other teaching, and has taught me to understand what your heart used to be. I have been bent and broken, but - I hope - into a better shape.”
- Estella Havisham (Great Expectations by Charles Dickens)
Foreword
This is the first post for this diary since the transition to MGoBlog 3.0, and at this point I still haven't figured out the intricacies of getting Open Live Writer to display the formatting, accept the various descriptive tags, embed a video or how to to publish a post (which gives me error messages), so I'm resorting to doing a semi-manual piece-meal upload using the web interface, which is less functional than it was on MGoBlog 2.99, particularly regarding tables, which it apparently does not support? Not sure if the old "click to embiggen" hook works either, but anyway, here goes nothing…
The 2018 Still-sort-of-Pre-season Ratings
Winter is not coming anytime soon. The long, dark offseason is nearly over, and the hope that springs eternal is flowing like the salmon of Capistrano with anticipation of great – or at least better – things to come for this year's team, Team 139. The missed opportunities and abject failures of the 2017 campaign are thankfully in the past, a place that's not great for living anyway, and so there's no need to dwell there for very long. The coaches and players alike took their lumps and learned some hard lessons from those experiences, so leave it at that. Indeed, the level of experience going into 2017 was one of the lowest in the entire NCAA, an anecdotal stat that often gets lost in the paralyzing analyses of what went wrong. For example, the lack of experience extends beyond the MGoBlog mantra of "Freshmen receivers suck" to encompass the entire defensive secondary. Not that the secondary actually sucked on any level comparable to the receivers, but they were a young bunch that did have its share of faults and missteps along the way. That said, it's presumed that anyone reading this would trade neither M's receiver nor defensive secondary groups for any other in the nation. Such is the difference a year makes, and that is the hook upon which this team will hang its collective hat. Beyond what amounts to an order-of-magnitude increase in team experience, still other changes have been made to right the submarine and bring its capabilities to bear in full force, not the least of which is the command structure. To his credit, Harbaugh has recognized the tactical failures along the offensive line and the widespread impact it's had on M's offensive performance overall. Ousted were Tim Drevno and Greg Frey, who shared the O-line duties to ensure that confusion would rule the day. The results were palpable most of all to the quarterbacks, not to mention all of us who witnessed them running for their lives, or not. Enter Ed Warinner – the Lord of the O-line, in whose wizardry we trust to turn this leaden morass in into something shiny, golden and powerful. One coach to rule them all, one coach to find them, one coach to bring them all and in the darkness bind them.

As for the bigger picture, its Warinner's acumen combined with that of Strength & Conditioning coach, Ben Herbert, along with a good measure of tactical RPO and a fleet-footed QB transfer in Shea Patterson, that may be just the melange of tactics, training and talent that will finally result in M's QB staying clean and upright for enough plays to actually complete drives and better yet, games. That's the hope, at least.
So, now it's to have a look at what lies ahead for the 2018 season, from the fancy stats perspective. To that end, this diary analyzes some of the preseason Advanced Stats-based ratings for Michigan and the rest of the Big Ten. Most readers are already familiar with the two principal resources that will feed this analysis: Bill Connelly's 2018 S&P+ Ratings (of FB Outsiders and SBNation FB Study Hall fame) and ESPN's 2018 Football Power Index (FPI) Ratings. The rub with these initial, preseason ratings, both of which came out in early February, is that they apply a completely different set of metrics than do the in-season ratings. The way they differ is that these preseason metrics are leading indicators conceptually, and do not apply any aspect of in-game performance. To elaborate, the S&P+ preseason ratings are derived from the following three components:
-
Returning offensive and defensive production (56% weight)
-
Recruiting impact (25% weight, based on the last 2 years of recruiting rankings)
-
Recent win-loss history (19% weight, counting 2 to 5 years back, but not including last season)
Similarly, ESPN makes its preseason FPI sausage using three components that are similar to those of S&P+, plus a fourth:
-
Returning starters (with special consideration given to a team returning its starting quarterback or gaining a transfer quarterback with experience*)
-
Recruiting rankings (average rank among 4 systems: ESPN, Scout, Rivals & Phil Steele)
-
Prior performance (counting the last 4 seasons, with the greatest emphasis on last season)
-
Returning head coach (is this a good thing? 0.5/s)
* – These FPI ratings were done before the Shea Patterson transfer was a done deal, however, since these ratings already assumed a returning starter in the form of Brandon Peters, the FPI model would not be likely see any change, as it really does not factor in the performance of specific players.
Yet, in the end, both S&P+ and FPI provide ratings for all 130 FBS division teams, where the final rating is scaled to expected points better (or worse) than the average FBS division team at a neutral site. Simple enough. So without further ado, following is quick rundown of the ratings for your 2018 Big Ten football teams.
B1G S&P+ Ratings
B1G FPI Ratings
Schedules Matter … Big Time
At this point, a basic approach might be to just pull out the Big Ten teams and look at their respective ratings, as in table 1. Those more foolish than you might jump to the conclusion that the team with the highest rating would be expected to win its division and the conference. However, as Lee Corso might say, “Not so fast, my friend.” We all know by now, in the aftermath of the B1G moving to 9 conference games, that not all schedules are created equal, and that some provide more advantageous paths of glory than others. This is not just because of inter-divisional opponents drawn, but also because half the teams play 5 home conference games while the other half play only 4. That’s a 6-point year-to-year swing based on the scheduling constraint alone.
The next step is to evaluate each team's schedule and respective matchups, and determine the point spreads therein using the S&P+ or FPI ratings, adjusting for whether games are played at home or on the road. Simple enough. So then, let’s just sum up the wins and losses and have look at the final standings. After working out tie-breakers, determining which teams should be meeting in the Big Ten Championship Game straight-forward. As a bonus, since the ratings of each team have already been scraped up, let’s just calculate the average rating of each team’s opponents, and call it something like the Quick-and-Dirty Strength of Schedule (SoS), and rank order them while we’re at it.
Projected Final Standings from S&P+ Ratings
Projected Final Standings from FPI Ratings
The tables above don’t paint the prettiest of pictures – in fact if, if you squint your eyes just a little, you'd probably think you're looking preseason projections from last season. But … that can't be right, dammit. This team is supposed to be better than last year's team. Unfortunately, so are most of Michigan's strongest competitors. So then, let's try to digest this all one more time, shall we?
What is clear is that not only is OSU pretty much the highest rated team in all the land once again, it also has one of the easier schedules in the conference, once again. To compound matters, this is the year in which Michigan plays its two strongest divisional opponents, OSU and MSU, on the road. The only solace is that at least M has 5 conference home games, and this time around gets PSU and Wisconsin at home. That said, UM’s schedule challenges are still in the upper tier in-conference, and and the toughest in the conference when considering the OOC segment. So, at least that should bode well should Michigan maintain a place in the CFB Playoff discussion. Yet, what the projected S&P+ final standings show is M winning a 3-way second place tie-breaker a game back of B1GE champ OSU. On the FPI board, PSU finishes tied with the Buckeyes, but sneaks into the B1GCG by beating OSU head-to-head. M remains tied with MSU at 7-2 in the conference.
In the B1GW, Wisconsin’s schedule - like OSU’s - could not be much easier. And so it goes that the Badgers chances of blowing through the season unscathed and returning to Indy for the B1GCG are looking pretty good. That assumes Wisconsin can get past those sneaky Hawkeyes, who have drawn the easiest conference schedule in the B1G according to both S&P+ and FPI-based Q&DSoS’s.
Turning Spreads Into Likelihoods
The next step then is to map the point spread into odds, or better yet, the percent likelihood of each opponent to win, with a 0-point spread being the logical (if not statistically validated), 50/50 boundary condition. Back in 2015, Daniel Griffith, a MiniTab Blog contributor, posted a tidy statistical analysis of the differences between the point spreads and actual results for all NCAA games from 2000 through 2014. Suffice it to say, the distribution of differences was found to be Normal with an essentially zero mean (if it isn't zero-mean, then the bookies aren't doing their jobs, yo!). Knowing a formula or two about the characteristics of a Normal distribution, one can then compute the likelihood that an actual result is greater (or less) than the point spread.
Just as an aside, the most interesting point from the Griffith analysis is the following (which bears repeating if you’ve read this before) in regard to the distribution of differences:
"The standard deviation ... is 15.5 points. That means that if a game shows a spread for your favorite team of -3 points, the outcome could be with high confidence within plus or minus 2 standard deviations of the point estimate, which is -3 ± 31 points in this case. So your favorite team could win by 34 points, or lose by 28!"
That, dear reader, is why they play the games.
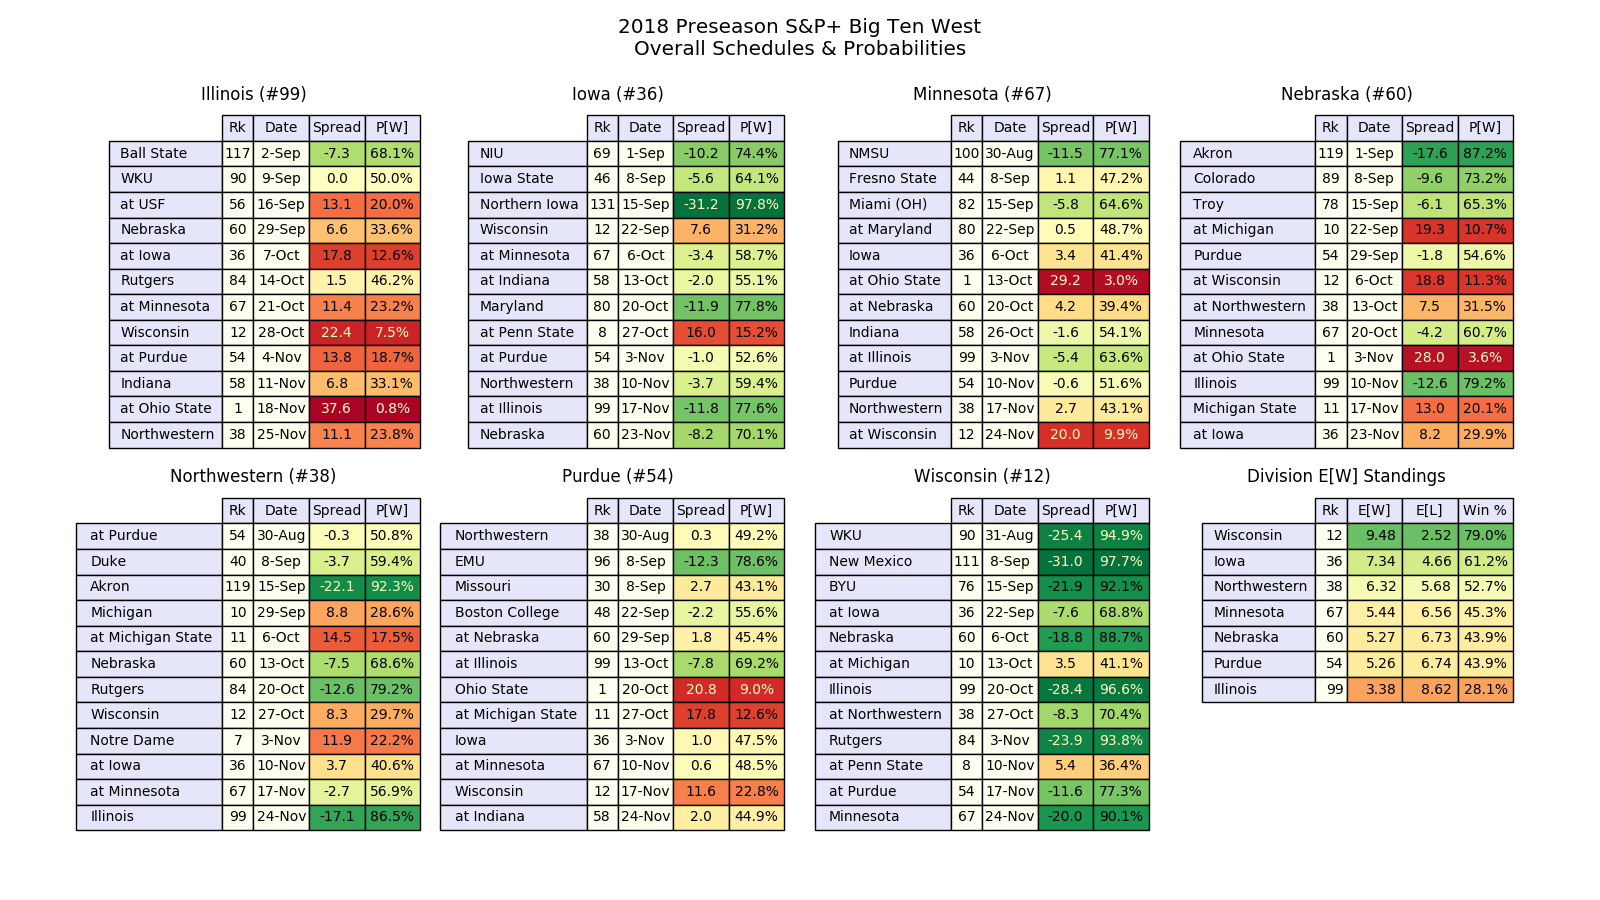
The following two tables of tables show the schedules for each team in the B1G East & West divisions, including the S&P+ ratings-based point spreads and attendant win probability (links to the FPI results are also provided below). A green-yellow-red pseudo-colormap is also applied to quickly give a qualitative indication of where each team faces its greatest challenges, how those challenges stack up, and by comparison, which teams have a more or less difficult row to hoe. Green indicates a favorable point spread; yellow, a competitive matchup; and red, an unfavorable margin. The last table simply shows a rank-ordering of the divisional teams based on their expected in-conference win totals - it’s not a projection of conference standings based on projected wins, losses and tie-breakers.
B1GE Schedule Likelihoods
S&P+ Results

FPI Results

B1GW Schedule Likelihoods
S&P+ Results
FPI Results

Total Win Probabilities
After computing projected win probabilities for all the games in each team's schedule based on the ratings-based point spreads (including a +3 point rating adjustment for the home team), it's possible to compute the distribution of total expected wins at the end of the season. The one vagary in this analysis is in regard to FCS opponents. Since neither S&P+ nor FPI provide ratings for FCS teams, I've taken the liberty of assigning the lowest available rating of -30 and -24 to FCS team, respectively. That said, there is only one FCS game in the entire conference this season: Iowa vs. Northern Iowa on September 15. It seems the Hawkeyes are trying to milk the FCS level competition as long as they possibly can.
The B1G East Distributions
In the B1G East, the teams can be grouped into four classes: the Out-and-out-liars (Ohio State), the Contenders (Penn State, Michigan State and Michigan), the Bubble (Indiana) and the Bottom Feeders (Rutgers and Maryland). The Contenders are those teams that by one rating or the other, are shown to be within 2 total expected wins of the top rated team. The Bubble consists of those teams within 2 total expected wins of being bowl-eligible (or not). The Bottom Feeders are the teams with few prospects of gridiron glory or post-season hijinks.
Below are the charts of the overall and in-conference total win distributions for the B1GE based on the S&P+ and FPI ratings, followed by a brief digest of each team’s results.
Overall
S&P+ Results

FPI Results

In-Conference
S&P+ Results

FPI Results

Rutgers
What can be said about LOLRutgerz? OK, how about this: they have a not-so-newish coach with some OSU heritage and a 6-18 record. It’s time for some of those recruits that were promised early playing time to step up and make good. Given that, prospects are looking a shade better for the Scarlet Knights in 2018, but not enough to pull them out of the cellar. Basically, they're staring at a 14% (S&P+) to 17% (FPI) chance of not having a losing season, including a near freebie from Texas State. Their most likely record once again is about 4-8, or somewhere shy of 4 wins, and are double-digit dogs in six of their games. It still doesn't look like there's any chance that the '14 win over Michigan is going to be dislodged from the Pantheon of LOLRutgerz Classics anytime soon.
Maryland
To imagine what had been going on during practices at Maryland is just sad and depressing, and it’s chilling to think that D.J. Durkin had been the DC at Michigan for a year, quite possibly perpetrating the same sort of abuse. Seeing things now in the cold light of day, anyone can recognize an abusive culture that was so ignorant as to be negligent - to the point that it precipitated the death of a bright, young student-athlete who still had his whole life ahead of him - was beyond the pale of acceptable practice for running a modern football program, much less an institution for higher learning. Heads must roll.

As for the Terds’ football team this season, it look like a big "meh" that, overall, is marginally better than LOLRutgerz, with a 16% (S&P+) to 30% (FPI) chance of not having a losing season. Like Rutgers, Maryland’s most-likely record is 4-8 (5-7 FPI), and are double-digit dogs in five (six per FPI) of their games.
Indiana
The S&P+ data says Indiana is still looking like the ultimate Bubble team - and the only one in the B1GE at that, predicting a 6-6 record with a mode of 6 wins that leans strongly toward 5. However, FPI says Indiana will be backsliding a bit toward the miserable company of Maryland and LOLRutgerz. That's what running a football program with proper oversight that has a sense of swift justice gets you. Kevin Wilson was summarily fired after going 6-6 and qualifying for a bowl; Tom Allen is 5-8 since. Anyway, FPI says the Hoosiers will probably win only 4 games, but 5 of its games are within a one-score margin.
Michigan
With the expected retrograde shift of Team 138, it appears that it may take some time yet to rekindle the torrid love-affair that was the S&P+ and the first two seasons of Harbaugh's Wolverines. For Team 139, the probable record stands at 9-3 (7-2) as per both S&P+ and FPI. Both S&P+ and FPI show modes of only 8 wins for Michigan, but with strong leans toward 9 wins. Michigan is favored by double-digits in 6 games by both S&P+ and FPI (down from 8 last season), and has margins of less than one score in 4 (or 5) games per S&P+ (or FPI). Notre Dame, Michigan State and Ohio State at this point are all favored at home by both S&P+ and FPI. However, UM is favored at home over Wisconsin and Penn State by both S&P+ and FPI. The Nov. 10 tussle with Penn State looks like the closest matchup on the season, but the opener in South Bend will be critical from the standpoint of getting UM off the schneid and setting the tone for the remainder of the season.
Here another round of sobering statistical observations:
-
Chances of a Michigan losing season: less than 2%.
-
Chances of Michigan improving on last season’s win total (9 or more wins): 45-49%.
-
Chances of Michigan going undefeated: vanishingly small.
Michigan State
It's fair to say that last season Sparty demonstrated the principle of Phil Steele's Stock Market Indicator, whereby they rebounded to 10-3 from a down year (3-9) after having strong seasons the preceding two years (12-2 and 11-2). On the bright side, S&P+ gives Sparty a 13% chance of improving its regular season win total from last year, while FPI gives them a 17% chance. Sparty’s most likely record is looking to the will hold at 10-2 (7-2) per both S&P+ and FPI. Only 3 spreads are less than one score (2 being its only underdog matchups), with all the other being greater than double-digit favorites. MSU still has a 39% to 44% chance of improving its record over last season's mark (10 wins or more), with a slim 2-3% chance to win’em all. This is founded largely on the strength of its returning production (ranked #9 by S&P+) and its defense overall (ranked #10 by FPI).
Penn State
Despite losing B1G All-time RB Saquon Barkley and Don Moorehead, the man behind the curtain pushing all the buttons and pulling all the levers, Penn State appears to have maintained its second banana status in at least the B1GE, although by the thinnest of margins. Indeed, its win distribution is nearly indistinguishable from Sparty. Although the Nits are favored by double-digits in eight of its games, the other four are less than one score margins. As such, S&P+ has PSU going 10-2 (7-2) on the season, with FPI showing a little more love at 11-1 (8-1) and stealing the B1GE title by beating OSU at home. What's declined for the Nits is that they are slight underdogs to UM in Ann Arbor by both ratings this time around. If the Nits can down the Buckeyes the preceding week, they'll be flying high coming into Ann Arbor with the B1GCG and a CFP invitation on the table. Statistically, despite its surprising over-performance last season, PSU still has a 18% to 20% chance of improving its record over last season's mark (11 wins or more), with a slim 3% chance to win’em all. This is founded largely on the strength of its recruiting and returning production (ranked #8 and #10 by S&P+) in the form of 2nd-team All B1G QB Trace McSorley, and its offense overall (ranked #3 by FPI).
Ohio State
Not many teams rank ahead of MSU and PSU in returning production, but one of them happens to be Ohio State, at #1 up from #3 last year. Hunh? OSU was one of the youngest teams in the country in 2016, when they made the CFP as freshmen and sophomores. Pretty much everyone is back except J.T. Barrett. Looking ahead, OSU is poised to separate themselves from everyone else by going 11-1 or 12-0 overall (S&P+ or FPI). OSU is not only favored by double-digits in 9 (8) games by S&P+ (FPI). Its toughest matchup will be week 5 in Happy Valley against the Nits , who is less than a one score underdog per S&P+ or favored by less than a point by FPI . In conference, S&P+ shows OSU with a mode of 8 wins, which is incrementally greater than the 7-win modes of PSU and MSU, both of whom have strong leans toward 6 wins, clearly making OSU the team to beat. What’s remarkable is the peakedness of the OSU distributions, which means the chances of variation from near-perfection are not as great as others’ variations from not-so-perfection.
Other sobering statistical observations:
-
Chances of tOSU improving on last season (11 or more wins): 31-40%.
-
Chances of tOSU losing 3 or more games: 15-35%.
-
Chances of tOSU having a losing season: vanishingly small.
The B1G West Distributions
Unlike the last several seasons running two teams get classified as Contenders (barely) in the B1G West. Of course Wisconsin is one of them; the other is actually Iowa largely by virtue of their weak Q&DSoS. However, the B1GW Bubble is bursting with 4 (or all 5) of the remaining teams: Northwestern, Minnesota, Nebraska, Purdue (and Illinois) as per S&P+ (FPI). S&P+ still relegates Illinois to the Bottom Feeders class, picking up from where they were left for dead last season to carry on like zombies looking for something to bite.
Below are the charts of the overall and in-conference total win distributions for the B1GW based on the S&P+ ratings (with links to the FPI charts), followed by a brief digest of each team’s results.
Overall
S&P+ Results

FPI Results

In-Conference
S&P+ Results

FPI Results

Illinois
S&P+ numbers put Illinois is a full two wins below the morass of Bubble teams in the middle of the B1GW field. S&P+ has the Illini favored in only one game this season, its first vs. Ball State. Then, it's all uphill from there, and they're pushing a big boulder. With a mode of 3 wins, Illinois could still benefit from some luck, but even so, they're 93% assured of having a losing season. On the bright side is the FPI, which places the Illini in the at the bottom edge of the Bubble with four other teams, giving the Illini a 33% chance of getting to at least 6 wins and Bowl Eligibility, which would be a major breakthrough for Lovie Smith and his crew.
Purdue
Things are inching upward for Purdue under 2nd-year coach Jeff Brohm. It's looking like another Bubble year for the Boilers, and making it to a bowl game 2 years in a row is something to hang a helmet on. S&P+ and FPI both show a most likely record of 3-9 (1-8) and 4-8 (3-6), respectively. That’s what not having an FCS team on the schedule does for you if you’re a bottom feeder. Yet, the Boilers have a mode of 5 wins according to both ratings, with strong leans to the high side of that. They’re chances of avoiding a losing season range from 44% to 48%, with the chances of going completely winless negligibly small. The main thing working against Purdue is their schedule, which overall is the third strongest in the B1G, but that's the sort of thing that gets a Bubble team into a bowl game.
Minnesota
Forecasts for the Gophers in 2018 continue to slide toward mediocrity with a most likely record of 5-7 (3-6 or 2-7) from both S&P+ and FPI. S&P+ gives the Gophers a 48% chance at bowl eligibility and FPI, a 53% chance – just a shade better than Purdue. P.J. Fleck is one who is investing (saving?) for the future (a rainy day?) however, taking a risk (not wasting a valuable scholarship?) by going with a Freshman walk-on as the starting QB. As usual, if he can just get the team to focus on its oarsmanship, they'll be across the lake in no time.
Nebraska
Next in the B1GW Bubble are the Cornhuskers, who are breaking in their new coach and savior, Scott Frost. Both S&P+ and FPI numbers place them at a perfectly mediocre 6-6 (3-6) record, with both S&P+ and FPI tilting toward the under. As such, S&P+ gives the Huskers a 44% chance of reaching bowl eligibility and FPI, a 52% chance.
Northwestern
Meanwhile, the ultimate B1GW bubble-team - that is to say the team most likely to break out of the bubble - would appear to be Northwestern. Both S&P+ and FPI forecast a most likely record of 7-5 overall, but a mode of 6 wins means the Cats are going to be facing some tight matchups. Either way, the Wildcats have a 71-72% likelihood of becoming bowl-eligible, a 46%-52% likelihood of having a winning season. These numbers are respectable for Northwestern, yet they do represent a retrograde move from the 10 win result of last season. Yet Fitz is dutifully cultivating this squad, and coupled with the return of 4th-year starting Sr QB and NFL prospect, Clayton Thorson, the Cats are not a team to take lightly or look past.
Iowa
Iowa looks to be up to its typically sneaky hijinks for 2018, because don't look now, but both the S&P+ and FPI predictions put the Hawkeyes at 10-2 overall, and 7-2 in the B1G. That's right – they're underdogs in only two games: at home against Wisconsin and at Penn State. This is good enough to finish tied with the Badgers for first place in the B1GW, with the head-to-head tiebreaker of course going to the Badgers. What's noteworthy is that the Hawks' mode is only 8 wins, which means they are in a boatload of close matchups in which they have a narrow edge. Indeed, 7 (9) of their games are single-digit margins per S&P+ (FPI), with both ratings showing 5 games within a single score.
Wisconsin
Despite drawing both Michigan and Penn State on the road as two of their cross divisional games (plus LOLRutgerz), and playing only 4 B1G home games as well, the Badgers still have nearly the weakest schedules in the B1G (13th and 11th by the S&P+ and FPI Q&DSoS, respectively). When you're the only top tier team in the B1GW, that's pretty much par for the course. It’s no wonder the Badgers’ most likely record is 10-2 (7-2) according to both ratings, with both losses being to Michigan and PSU. For once the Badgers are not favored in all of their games, and thus the opening for the Hawkeyes to steal a B1GCG invitation, as noted above. That said, the Badgers are double-digit favorites in 9 of its other games, and still a one-score favorite over Northwestern in Evanston, so the likelihood they will stumble is not great. Yet the opportunity is there – the Badgers show modes of 10 wins per S&P+, but only 9 wins per FPI, so the statistics could still work to Iowa's advantage. By all accounts, the B1GW isn't looking like the runaway it's been in years past, and the telling matchups for that race will be when the Badgers go to Evanston, and when the Hawkeyes go to West Lafayette in weeks 9 and 10.
Some noteworthy statistical observations:
-
Chances of Bucky going undefeated, again: 2%-3%.
-
Chances of Bucky losing 3 or more games: 47%-56%.
-
Chances of Bucky having a losing season: vanishingly small.
Overlay Redux
Just to wrap things up with a quick visual summary, here are the combined overlays of the total wins probabilities broken out by division.
S&P+ Overall

S&P+ In-Conference

FPI Overall

FPI In-Conference

The winner-take-all premise of competitive sports does not discriminate between a tooth-and-nail struggle for survival and a ruthless clubbing of a baby seal. A win is a win, and no more and no less than a win. Ol' Al Davis was on to something when he wisely said, "Just win, baby!" Yet when it comes to the Bowl Selection Committee, some wins are bigger and better than others, and some losses can be bad. Very bad. Particularly when outcomes can be tilted by a single 5-minute squall, a single injury, or a single dropped ball, at which point distorted perceptions of competitive advantage begin to rule the day in order to make aggregate performance on the field somehow balance with the collective outcomes.
In the end, if a team can in fact manage to win the games it’s expected to win, and if that same team can also win the games it has a competitive chance in, then that team will have realized its potential, full stop. Those are some pretty big “ifs” for any football team of course. Yet, if such a team is indeed expected to win most of its games, and has a competitive chance in all its other games, and if that team plays as a team, then when the old season is over, you and I know, it’s gonna be Michigan again. Michigan.
Yours in football, and Go Blue!
August 31st, 2018 at 12:06 PM ^
Whelp, that didn't come through entirely right and since now I can't edit or update it (but I can edit this comment ¯\_(ツ)_/¯), below are the tables that were left out. and since the click to embiggen thing isn't a thing anymore, here is a link to an album of the charts if you'd like to see bigger and more readable versions. It includes some bonus charts based on the ratings from Power Rank, along with some head-to-head probability distributions for some contender matchups:
2018 B1G Pre-season Margin Schedules and Win PDF Tables
B1G S&P+ Ratings

B1G S&P+ Projected Standings

B1G FPI Ratings

B1G FPI Projected Standings

August 31st, 2018 at 2:21 PM ^
You might not be able to "click to embiggen", but you can right click and open in a new tab.
August 31st, 2018 at 4:34 PM ^
Interesting that Iowa looks to be primed to compete with Wisconsin for the West when Northwestern seems to get most of the attention for that chance.
September 1st, 2018 at 2:20 AM ^
The B1G S&P projected standings have us losing to ND but if we win, we could end up 10-2, which would not be that bad of a season as long as we beat one of the @State schools.
September 1st, 2018 at 12:36 PM ^
Nice work.
Comments