2013 Turnover Analysis – Updated Thru Nebraska
What The Hell Is Going On Out Here!: In unison, the entire Michigan fan base was quoting Vince Lombardi on Saturday. Gardner has just one giveaway in the last 2 games and the offense has NEVER looked worse. If this is what ball security looks like --- fagetta bout it! Devin looks tentative on just about every throw and every run. I'm not buying the "lack of talent on the O line" either. This is just horrible, horrible play calling/coaching. Unless something changes drastically, M is looking at 6-6 (and how does 10-2, 8-4, 6-6 look for the first 3 years).
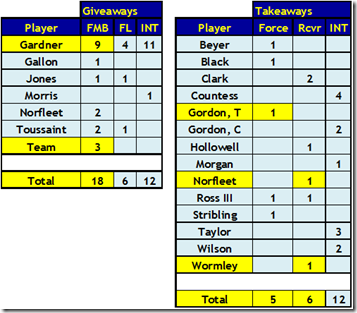
Synopsis: Michigan's TOM for the game was +2.0 and that should have been enough for a victory. The first takeaway resulted in 2 yards in 3 plays and a missed 52 yard FG. The second takeaway was run, run, run for a massive total of 3 yards and a 40 yard FG. You don't win very many football games when scoring only 13 points.
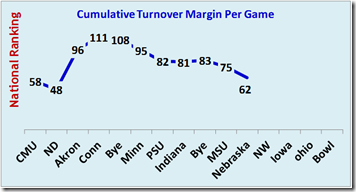
For the year M is now dead even at 0.0 TOM and improved to #62. Turnovers were not a primary factor in determining which team won the game. Tam Gordon forced a fumble that was recovered by Wormley and Norfleet recovered the muffed punt and ran it in for the touchdown. Stupid rule if you ask me.
Next Week: For the year, Northwestern is somewhat better than Michigan for turnovers. NW has 1.8 giveaways per game ranked #70 and 2.4 takeaways per game ranked #17 with a +0.60 TOM per game ranked #25. Oddly, NW has a worse TOM at home (+0.2/game) versus on the road (+1.0/game). NW is ranked #3 for interception takeaways with 2.0 per game. Michigan has a TOM of –0.7 for road games.
 Player Details: Here is the overall summary for all games by player (data in yellow was affected by this week's game).
 National Rankings: All rankings include games between two FBS teams ONLY and are from TeamRankings except for forced fumbles which is from CFBStats.
  The four columns with *** show the best correlation to offense and defense (per Advanced NFL stats).
![image_thumb1_thumb_thumb_thumb_thumb[2] image_thumb1_thumb_thumb_thumb_thumb[2]](http://mgoblog.com/sites/mgoblog.com/files/image_thumb1_thumb_thumb_thumb_thumb%5B2%5D_thumb_0.png) Turnovers And Winning: This chart shows turnover margin (TOM) at the end of the season versus the percentage of teams with a +4 WLM (8-4 record) or better. [WLM = Win/Loss Margin = Wins – Losses]
Turnovers And Winning: This chart shows turnover margin (TOM) at the end of the season versus the percentage of teams with a +4 WLM (8-4 record) or better. [WLM = Win/Loss Margin = Wins – Losses]
Expected Points: The impact of each turnover depends upon the down, the spot the turnover is lost, and the spot the turnover is gained. 
This chart shows Expected Points for various yard lines.
This chart shows the basis of EP calculations for each turnover.
November 11th, 2013 at 2:32 PM ^
weren't we 7-5 last year?
November 11th, 2013 at 4:00 PM ^
8-4 regular season and lost the bowl game
November 11th, 2013 at 10:32 PM ^
You have your Gordons mixed up. T Gordon has 2 picks. C Gordon has the forced fumble.
November 12th, 2013 at 12:15 PM ^
I messed up my cut and paste. Thanks, I'll make the correction.
November 12th, 2013 at 12:28 AM ^


Comments