Moving the Stati-Sticks: Post-MSU

[Barron/MGoBlog]
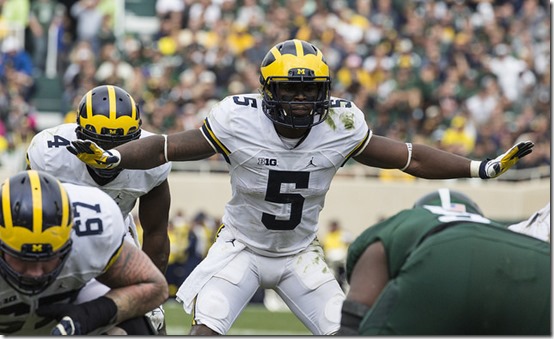
Three years ago, Devin Gardner walked off the field defeated in every conceivable way. Really, he “walked” only under the loosest possible definition of the word. “Staggered” is far more accurate. I was reminded of that this week when it somehow came up in conversation and I saw a gif BiSB posted from the 2013 game of Gardner, mud-stained to the point where it’s hard to make out the numbers on his shoulders, hobbling off. [Ed. (A)- BiSB conveniently led Opp Watch with the gif, so scroll down a bit to see what I’m referencing.] That year’s gif post was six gifs. Six. Ace mentioned in our MGoSlack chat that he clipped 75 things this season.
As it stands today, ESPN’s FPI gives Michigan a 39.6% chance to win out. Bill Connelly’s numbers at Football Study Hall are far more generous; he gives Michigan a 61% chance to win out. According to Connelly, Michigan has a 96.4% probability of finishing 11-1 or better. Against Ohio State, Michigan’s lone remaining game whose win probability isn’t 93% or higher, his numbers say Michigan has a 68% probability to win. Yes, Michigan busted a few times against Michigan State. They got scored on late in the game, scores that lifted the game out of garbage time. That Michigan went on the road in a rivalry game and met Connelly’s criteria for garbage time is a feat in itself, and you only have to click on that gif post above to really appreciate what this team has been able to do. That may seem like an overly emotional response, but Michigan’s aggregate numbers bear out their dominance, particularly on defense.
[After THE JUMP: the numbers that bear out Michigan’s dominance, particularly on defense. oh, some Heisman stuff, too.]
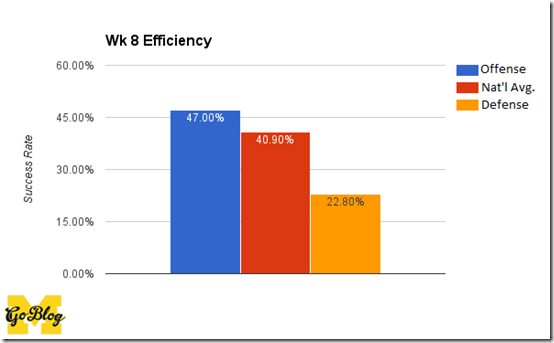
The dominance, it should be noted, has been in the aggregate. If Mark Dantonio’s goal was to send a mental message, I guess it worked in that I noticed the numbers got sort of close in a few categories. He got to within about a half yard of Michigan in yards per play thanks to some garbagy stuff in technically non-garbage time. Oh, and his team averaged only about 1.5 points per scoring opportunity less than Michigan. His team outperformed the defense’s average Efficiency, field position, and points per trip inside the 40.
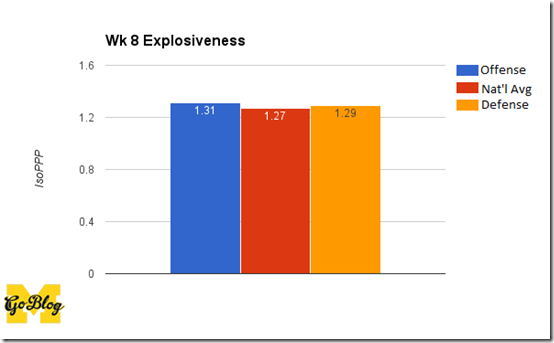
Even so, all that didn’t do much to move the needle. Michigan’s offense and defense are both better than average in three of the Connelly’s five primary factors, and the defense’s Explosiveness number continues to fall.
State’s Success Rate did outpace what Michigan had been allowing. Their 36% SR bumped Michigan’s cumulative defensive SR up a couple percent, though it still fell below the national average. Michigan’s offense, meanwhile, displayed some consistency; they had a 45% SR against MSU to go with 47% on the year. The way to interpret that is that Michigan is getting the yards they need to stay in favorable down/distance situations (50% necessary yards on first down, 70% on second down, and 100% on third or fourth down) about half the time, which puts them in the top 25 in this category.
There’s not a ton to say here about IsoPPP. Everything’s jammed together, and it’s been that way for the last few weeks. The offense is slightly more explosive than average, and the defensive number continues to take tiny steps back toward average.
Michigan State’s field position numbers were admittedly a bit of a surprise. You can see from the chart that Michigan’s had a decided advantage in starting position this season, while their opponents have been a few yards below average. Michigan State had the better average starting field position (29.3) against Michigan, which started from their 28.6 on average. As far as I can tell from the drive charts, this is attributable to Michigan taking over on downs deep in their own territory multiple times and a missed field goal that led to them starting a drive at their own 20.
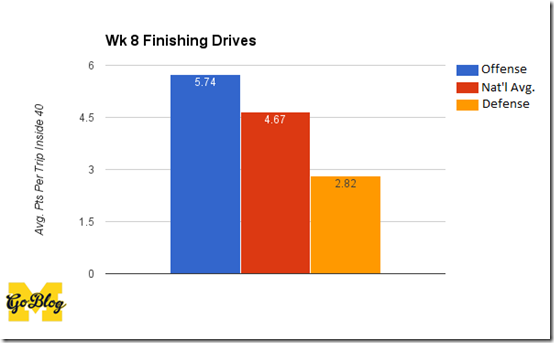
The first five times Michigan State got the ball, they obtained it via kickoff. All of a sudden the offense averaging 5.74 points per trip inside the 40 doesn’t seem so ludicrous.
For most of the season Michigan’s been stopping teams when they cross the 40. They did that against State as well, stopping them on downs three times inside the 40; this number also was aided by a missed field goal. The two touchdowns and field goal Michigan State did hit were offset by the aforementioned four stops, and Michigan’s defense is averaging the same number of points allowed per trip in inside the 40 that they were two weeks ago.
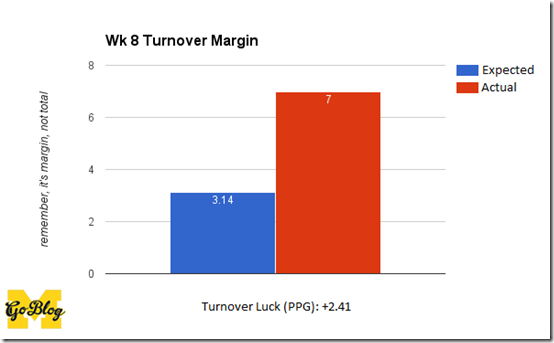
Michigan and Michigan State both had one turnover in the game, with both coming via interception. That leaves Michigan’s turnover margin in the same position it was before the game, and it just so happens that Michigan’s +7 margin is good enough to keep them just outside the top 10 nationally (they’re 11th, to be exact). That’s obviously a healthy turnover margin, but the bonus points per game they’re getting from creating turnovers is a modest 2.41.
As for regressing to the mean, it’s not something that I’d worry too much about. Even if the interception well was to dry up, Michigan’s been able to get so much pressure on quarterbacks that there’s likely a strip-sack or two on the horizon. Turnovers may be random, but Michigan’s defense is well stocked with personnel with a penchant for creating them.
One guy who has seemingly been on the brink of creating a turnover forever is Jabrill Peppers; sometimes I forget that he doesn’t have an interception until I check the numbers or hear from someone that it’s a topic of discussion on the RCMB again. I really wanted Peppers to be the focus of the conversation in this space, as I was hoping that there would be something else in the advanced stats that could further pull back the curtain on whether his Heisman candidacy has legs, some numbers that could be used to compare him to quarterbacks and running backs.
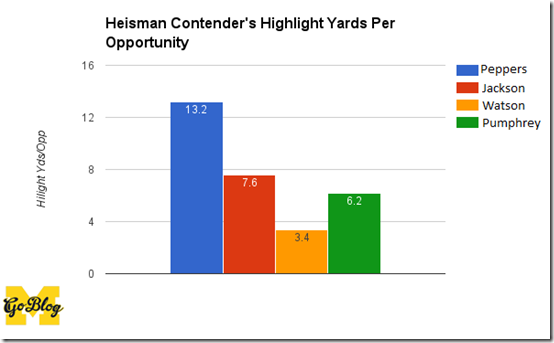
The natural starting point is to look at how Peppers’s rushing stats match up with Lamar Jackson’s, Deshaun Watson’s, and dark-horse candidate Donnel Pumphrey’s. Peppers’s advanced rushing stats stack up nicely against the three, as he’s averaging the highest number of yards per carry and the most highlight yards per opportunity despite having the lowest opportunity rate.
When looking at highlight yards per opportunity, it’s important to note that Bill Connelly defines an opportunity as a run where the offensive line picks up at least five yards for the runner. In his eyes, that line has done its job at that point, and whatever happens after is the attributable to the ballcarrier. Highlight yards is the total number of yards after those first five, and that number is then divided by the number of opportunities. Peppers’s number is incredible; the easiest way to interpret that is when he gets past the mass of bodies on the first level, he’s going to go a long, long way before he’s taken down.
As mentioned above, opportunity rate looks at how often the offensive line got the ballcarrier five yards. Peppers is working with the least number of times where the line did its job, though only Jackson’s number stands out as being exceptionally different (and exceptional by itself). The other side of the coin here is that this is sometimes looked at as a measure of a back’s efficiency. If he has a high opportunity rate but low highlight yards/opp then he’s a fall-forward, grind-it-out style back. Since Peppers’s opportunity rate is just 0.8% below the offense’s opportunity rate, it seems fair to look at his rate as attributable to the offensive line.
The problem with all of this is that it’s not a fair comparison. Jackson has rushed 130 times, Watson has rushed 79 times, Pumphrey has rushed 224 times, and Peppers has rushed a paltry 15 times. His numbers above may be great, but he’s still working with so few carries that it comes off as an apples-to-oranges comparison.
That’s just accounting for things that are remotely comparable, too. Peppers will undoubtedly throw out of the Pepcat at some point, but he’s never going to approach the number of throws Jackson and Watson have already attempted, let alone the number they’ll have at the end of the season. Pumphrey’s probably never going to throw, but he’ll likely end up doubling everyone’s carries. Then there’s Peppers’s defensive statistics, which are so impressive they helped boost him into the conversation, but which have no equivalent to compare against for any of the other candidates.
Peppers leads the team with 40 tackles, leads the team in TFLs with 12, has 3.5 sacks (and is just 0.5 sacks shy of tying for the team lead), and has recorded a forced fumble. Jackson’s completing 58.3% of his passes for 8.3 yards per attempt, while Watson’s completing 63.5% of his for 7.5 yards per attempt. How do you draw equivalencies in value between stat lines with categories as disparate as those? Additionally, how much value does Peppers’s 17.1 average yards per punt return and 28.0 average yards per kick return add?
The punt returns may win him the trophy, but they probably aren’t adding the most value from an equivalent-points perspective. This isn’t a criticism; his punt returns keep people from flowing up the aisles to the concession stands because people know extraordinary talent when they see it. The issue is with the number: Peppers has been able to return 15 punts this season, so even though he’s one of the most explosive returners in the nation from a pure yardage perspective, and even though his returns are a huge boon to Michigan’s expected points by way of starting field position, it’s another low incidence event.
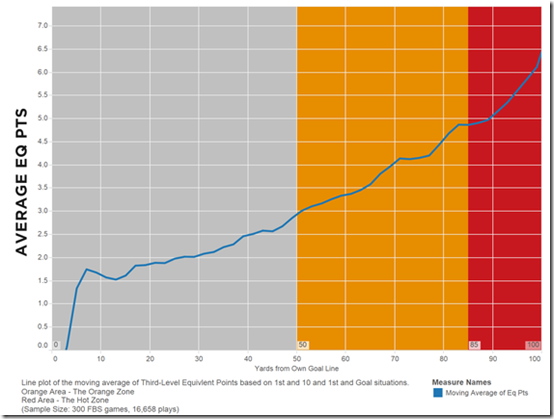
We know from Connelly’s work that it’s possible to assign a point value to every yard line. We also know that those values change depending on what down it is. Because of that, Peppers greatest value added is probably from his tackling. The equivalent point value of his fourth-down stop at MSU’s 13-yard line alone is almost 5 points prevented if we use the numbers from the Huffington Post graph below:
[via Huffington Post]
It’s easer to figure out that value on a fourth-down stuff because either the offense converted or they didn’t, and it seems fair to attribute the points prevented to Peppers for making the stop even though other guys helped put him in position to do so; he’s competing against quarterbacks who watch their yardage total tick up when a receiver bails them out, so there’s no such thing as a perfectly controlled environment here. Where it gets murky is something like a Peppers second-down stop at Michigan’s 25-yard line that went for three yards; maybe it goes for 30 if Peppers doesn’t make the tackle, or maybe there’s a safety behind him and the ballcarrier only would have gone three more yards. I’m really interested to hear what you guys think about Peppers, the Heisman, and using advanced stats to compare the candidates, so if you have any ideas for how to better look at their statistics please let me know in the comments.
Looking Ahead
Check out Ecky Pting’s excellent board post for a M vs. Maryland five-factors matchup, and then check out Ecky’s diary about the conference as a whole.
November 4th, 2016 at 1:32 PM ^
Michigan won. Awesome. Yep, we all hoped that Michigan would absolutely crush the Spartans. They didn't. A win is a win and we got the win.
November 4th, 2016 at 2:54 PM ^
DEFEATED WITH DIGNITY
November 4th, 2016 at 1:30 PM ^
If you could boil production per opportunity for a position down to one number and then scale that number to what fraction of that role a player plays, I feel like it might be fair. Kick returner needs to be weighted somehow.
Making up numbers here, if Lamar Jackson produces 1.6 times the expected points of an average QB and he has 100% of the opportunities a QB should have you've got 1.6*1=1.6.
If another player, saves 1.6 time the points a linebacker saves and produces 1.5 times what a QB produces, but only has 5% of the opportunities a fulltime QB would have, you've got 1.6*1+1.5*.05=1.675.
For Peppers, you have a lot of terms to add up, but most of them are multiplied by some small number.
Tough to argue how many points a defender saves (as pointed out), so that's not the stat you go with, but at least start will scaling stats to the average stats for that position.
November 4th, 2016 at 6:48 PM ^
I wonder if anyone has gone through and tried to calculate that for the Heisman contenders.
November 4th, 2016 at 1:31 PM ^
OK - let me calculate this Heisman data above and give you the results:
1. data into my inbox
2. calculate
whrrrrrrrrr - gurgle, gurgle - wooooooooooooooooooooop - bzzzzzzzzz - whrrrrrrrrrr - mmmmmmmmmmmmmmrump - gurgle - bzzzzzzzzz - wooooopppp
3. results:
Peppers
Jackson
Watson
Pumpmeuphrey
November 4th, 2016 at 1:34 PM ^
I think the point about trying to compare Jabrill's numbers to the others in the race is correct; the sample size is too small for it to be really convincing. The truth is that if it comes down to numbers, Jabrill is not going to win it. He needs memorable moments and voters have to be impressed by his superior athleticism and versatility. Any debate that revolves around statistics is too overshadowed by "Lamar Jackson has 100 touchdowns this season!"
November 5th, 2016 at 7:42 AM ^
It would be amazing to have the only two primarily defensive players to win the award from the same school.
Sent from MGoBlog HD for iPhone & iPad
November 4th, 2016 at 1:44 PM ^
In their own words, The Heisman is to be awarded to the most outstanding player whose performance exhibits the pursuit of excellence with integrity. The winners of the trophy epitomize great ability combined with diligence, perseverance, and hard work.
I'm not sure how you can be more outstanding or more of an epitomy of hard work, when you are a impact player on defense, offense and special teams.
Sadly, they haven't asked me for my opinion.
November 4th, 2016 at 4:43 PM ^
There have been winners from teams with less than perfect records and even one with losing records but if I recall right, that was Paul Hornung from the 1956 Notre Dame (2-8) and back then, probably one of the few teams with a coast-to-coast following and the media coverage.
November 4th, 2016 at 2:04 PM ^
November 4th, 2016 at 2:15 PM ^
Where are you getting Peppers leads the team with 40 tackles?
On MGoBlue they have Gedeon leading the team with 61 tackles and Peppers second with 48.
November 4th, 2016 at 2:51 PM ^
I wonder how SB nation does their stats?
Mgoblue has Gedeon leading the team with 61.
The NCAA stat page has Gedeon leading the team with 63 - http://stats.ncaa.org/rankings/change_sport_year_div
The Big Ten webpage also has Gedeon leading the team with 63 tackles - http://www.bigten.org/library/stats/fb-confldrs.html#indiv
November 4th, 2016 at 2:57 PM ^
common core
November 4th, 2016 at 8:48 PM ^
November 5th, 2016 at 3:50 AM ^



Comments