bracketology

I hustled this time and got it done. It's here. Update (6PM): NIT teams now added.
[Hey, today's the last day of College Football Risk. Go show the other schools why MGoBlog's community is so unfairly large they need to keep making rules to nerf us.]
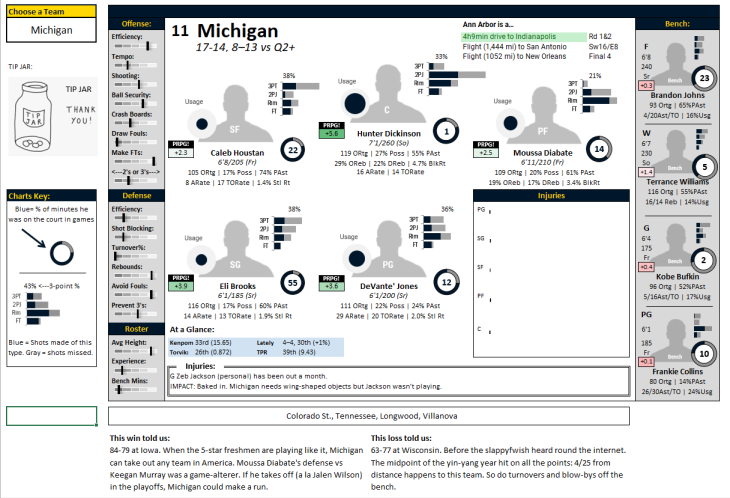
Every year I go way overboard in bracket prep. The result is all the data on all the tournament teams all laid out before out thusly:

For those of you who still have Excel, you get to automatically create YOUR VERY OWN SETHCHART IN EXCEL. That's a download link to the above. Put in the name of the team you want to look at, and it’ll show you the lineups and injuries and player data including the shot charts.
There's also a DUMBED DOWN GOOGLE SHEET VERSION I'm still working on if you can't get Excel to work and a simplified text only TEAM COMPARISON tool.
Those links allow you to download your own copy. FAQ for these graphics.
[After THE JUMP: how to use it and one or two findings.]
Every year I like to go a little (a lot) overboard in bracket prep. For those of you who still have Excel, you get to automatically create your very own Sethchart (that's a download link). Put in the name of the team you want to look at, and it’ll show you the lineups and injuries and player data including the shot charts.
Google Sheets has a hard time converting the pretty charts so you really need Excel for it, sorry. If one of you has the capability to convert these better please let me know and we'll make that available to the gentry.
I suggest taking some time to familiarize yourself the shooting charts, which show shot type and volume (specifically shot equivalents per 30 minutes) because that will show you quickly where a team’s scoring comes from and what kind of player each guy is. Usage (%Poss) also lets you know who’s driving the offense. PRPG! boxes are color shaded—they’re not perfect but they’re decent at picking out which players are problems for the opponent and which are problems for the team.
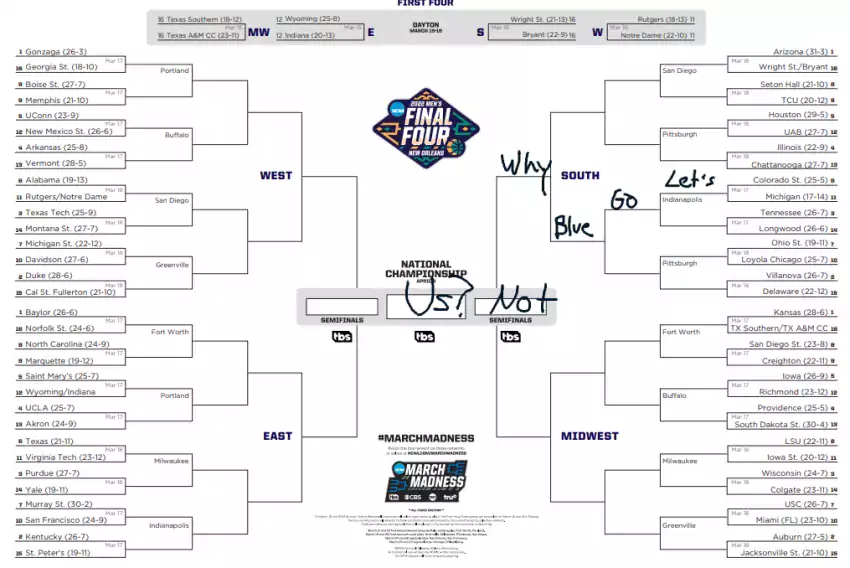
I also made the traditional Bracket Assist tool so you can compare two teams at a glance.
I highly recommend making your own copy so you can click around at your leisure.
Most of the data are from Kenpom and Torvik, with the injuries from a combination of lists, Kenpom data, and googling that resulted in ad-blasted local papers behind a paywall. Distance factor was calculated by putting the schools' addresses into Google Maps (I have a tool). The shot charts are data from Hoop-Math.
Two weeks to go, and the need for Q1 wins grows more clear

I want to emphasize that Kam Chatman beat #1 BTT seed Indiana at the buzzer

not like 80s music, like putting weird things together and having it work... okay like 80s music
26