Random Musings About NCAA Tournament Seeding
FREQUENCY OF SEEDS AND PERFORMANCE
It occurred to me that it might be interesting to do a high-level survey of the seeding of both the Final Four as well as the tournament champions and then look at ways we can check expectations (i.e., that the higher seeds should go to the better teams overall) versus results (i.e., the actual seed of the champion).
As some of you may be aware, seeding as only been a thing since 1978, so this was a constraining factor in the data collection, but there is definitely enough there to see some interesting phenomena in the data. A couple things that I did not know, just as examples:
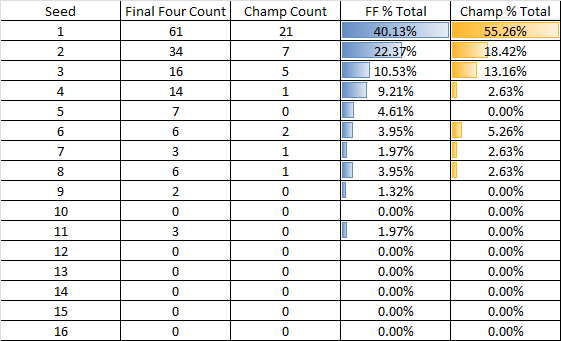
- As much as we talk about 5-12 matchups in the tournament, a #12 has never made it to the Four. An #11 seed has made it, however (three times).
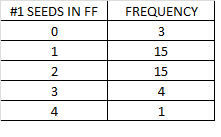
- Only once since the tournament was seeded did all the #1 teams survive to the Final Four (2008)
- Only three times since the tournament was seeded did no #1 teams make it to the Final Four (1980, 2006 & 2011)
There are other interesting tidbits you can glean from it, of course, but something that is just as interesting, or so I believe, is some of the other trends buried in the data.
First, here’s the seed count for all 152 teams which have graced seeded Final Fours in the NCAA tournament:
It should look exactly like you might expect, which is the point here. Indeed, by the time you get out to the 4-seed, you are at 82.24% of all teams that have played in a Final Four game, which in 152 games leaves only 27 instances where a team has been lower than the 4-seed (in the case of some years, multiple seeds were lower than that, of course)
Days later, as we know, three of these teams are gone – two in the Final Four and one in the NCAA Championship Game. Here’s the seeding frequency of those that won it all:
As you can see, truly quizzical endings to the NCAA Tournament have been a sparse exception statistically, with only four of them ending with a champion that was seeded as lower than a #4, and of course, one of them is that Villanova team (at #8) that made what some have argued is the quintessential Cinderella run some 30 years ago.
What about any sort of performance metric though? I wasn’t sure how to approach it – we’re just talking about the seeding, after all, so we have to make an assumption that one of the four #1 seeds is the best of the best, or at least that they are deemed such by how they are seeded and what they actually do in the tournament. The expectation then might be that all four of them should make it to the Final Four, but that only happened once to date for as we also know, there are far too many variables in a basketball game, human and technical – the countless upsets in tournament history are a testament to that.
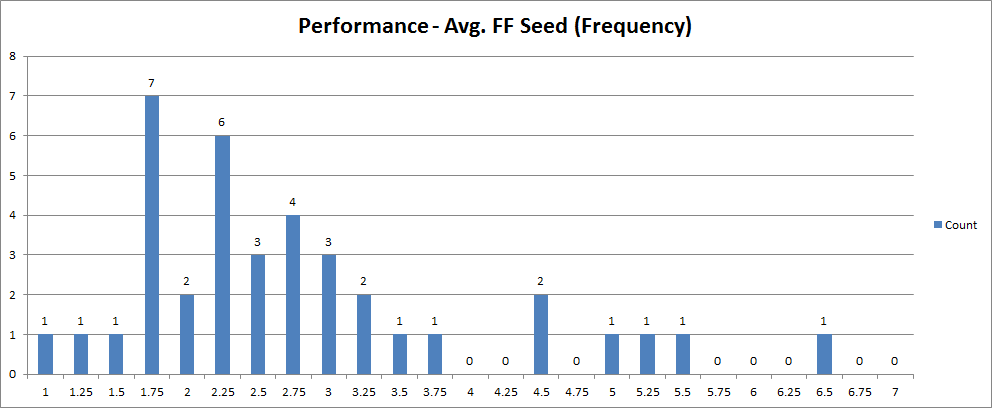
Something that I thought was interesting was to look at the average seeding of the Final Four teams through the years and then build a frequency chart with those averages:
There you see the sole time all participants at this stage of the tournament were #1 seeds, but look at how many times the average has been less than 2.00 – only 10 times. Here’s part of the reason:
In 30 of the tournaments since seeding began, the Final Four has seen only one or two of the #1 seeds make it, although as you saw earlier, a #1 seed has won on 21 occasions.
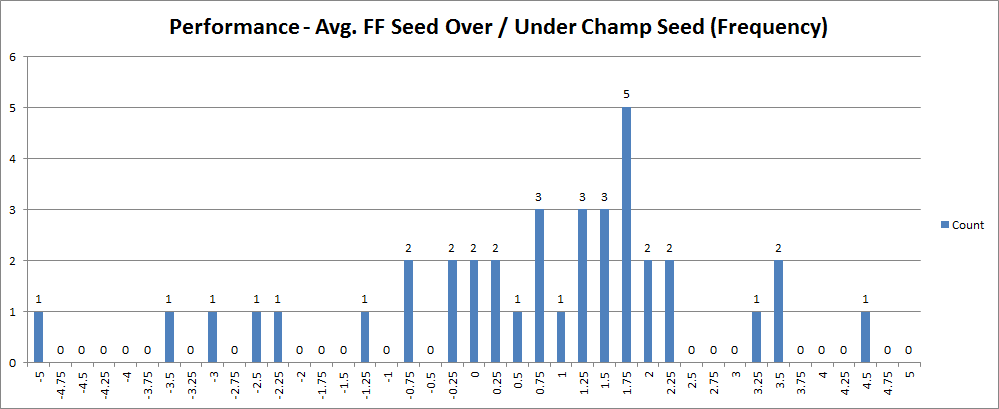
Another assumption we have to consider is seeding as an indicator of projected performance, which is one that we all make typically when doing brackets, but team performance is taken into consideration as well when the committee does lays out the 64 and 4 as well. Taking a shot in the dark regarding how we can use this to look at the performance of the committee as well as the winners versus their seeding, I subtracted the champion’s seed from the average of the corresponding year and got this frequency chart:
The overall results are interesting – we find that in 26 of the 38 tournaments which have employed seeding, the champion’s seed has fallen above the average seed of the Final Four, which I would argue is “overperforming” in that, well, a higher seed beat the average quite simply. This includes all 21 occurrences of a #1 winning the tournament, but also some outliers – 5 instances where a non-#1 seed won and still outperformed the average seed of the Final Four – 1979, 1980 and 1997, where a #2 won, and 2006 and 2011, where a #3 won.
Here’s another chart where you can see how rare the Cinderella story is as well – that -5 belongs to 1985’s Villanova team, with an average seed in the Final Four of #3 and Villanova winning it all at #8. It happened again in the 1980s, however – the value -3.5 is 1988’s result, where the average seed was 2.50 and the tournament was won by a #6. Of course, there’s 1983 as well and that improbable run by North Carolina State at a value of -3.00. These are the examples of the unlikely becoming possible, where a team was probably seeded below their actual potential – misjudged, if you will. Other interesting note – only twice has the average seed of the Final Four matched the seed of the champion – in 2004 (#2 won) and in 2008 (#1 won).
You will note, however, that 22 of these 38 results fall between 0 and 2, meaning that in nearly 60% of the tournaments – at least this is how I read it – the Final Four results versus the champion seed fall fairly close or almost right on the default expectation. In other words, slightly more than half the time, they appear to get it right in the end despite all the chaos that seems to happen in earlier rounds in some years.
A moment of Zen, courtesy of the movie "Crazy People":
The NCAA tourny is hideously bloated in my opinion. Of course, we can't go back now beacuse of money for broadcasting the games and the cachet for coaches of getting to the tournament. But if the chance for a 9 seed or below is so very small to win it (they haven't done so in multiple hundreds of opportunities), what is the point? It has become something that a coach can put on his or her resume, not a realistic chance to win a championship.
So....you're complaining that we get to watch more sports? I would not have bet $1 at infinity-to-one on MTSU winning the tournament this year, but watching them beat Sparty was one of the highlights of my sporting fandom.
March 24th, 2016 at 10:10 PM ^
Oh man is that Volvo ad real?
March 24th, 2016 at 10:30 PM ^
Unfortunately no. It's from a movie called "Crazy People", which is about an advertising executive who grows tired of lying to people and decides to begin telling the truth in his work. I highly recommed it if you have a couple hours. Another sample:

March 26th, 2016 at 12:55 AM ^
March 25th, 2016 at 11:15 AM ^
How well does a team's initial seeding predict performance after correcting for schedule difficulty? eg the fact that a #1 starts with a #16, the #2 with a # 15 opponent etc. For example, a #1 does not have to play another #1 until the the final four, if at all. However lower seeds may face this double jeopardy.. For similar but more complex reasons, I suspect that the chances of a #2 to advance in the tournament would be greater than that of a #15, even if they were equally good.
I also wonder how well a team's seed would predict performance compared with computer ranks, which have been validated vs teams' actual performances.
Perhaps one could also improve the latter by considering relative distance from each site, (but that would take a lot of work). In any case, if a #1 seed is more likely to play its first round near home, that could give an even greater advantage vs. lower seeded teams.


Comments