Offense
[Ed: bump!]
Back in April, I wrote a diary called Blue Moon in my Eye in which I developed a regression model that could be used to develop a projected win total assuming that reasonable estimates had been used as inputs. At the time I thought that the team would be capable of winning at least seven, probably eight, and maybe even nine out of thirteen games this season. Since then, things have, uh, how do you say … changed. With the loss of Woolfolk, how do those numbers change?
The New Blue Moon
 Before I get to that, there’s a good reason to update the model. In April, I mentioned that turnover margin is meaningful factor in regard to outcomes, but I lacked enough data to break it out specifically and therefore decided to leave it as a lumped parameter; turnovers were doomed to fade into the ether that is Intercept. No more, the NCAA has finally included turnover data in its database and now there is enough data to mix into the model. The new model has an improved R-squared value (0.752 as improved from 0.675) using just three end-of-year factors: offensive yards per game, defensive yards per game, and total turnover margin. Last time I didn’t include the model because it was mine, my own, my … preciousss. That was incredibly lame and nerdy (both with holding the coefficients and referencing LOTR) but we’re talking stats here so no one should be surprised. Another reason for divulging the goods is, now that there are four dimensions, a chart would be useless. Behold, the Blue Moon Model coefficients:
|
Coefficients |
Norm. Coefficients |
P-value |
|
| Intercept | 0.579253998 | 0.515607437 | 3.79693E-55 |
| OffYds/G | 0.001753298 | 0.107573121 | 7.5351E-118 |
| DefYds/G | -0.001981349 | -0.112371575 | 2.1098E-122 |
| TrnOvrMgn_Total | 0.007973783 | 0.065213954 | 5.75637E-50 |
- I left the P-Values in there for those who know what that is. For the rest of you, it suffices to say what I said last time: that ish be money, yo.
- The second column (Normalized Coefficients) is there to demonstrate the relative importance of each factor; in short, defense is a skosh more influential than offense and turnover margin is a little over half as important as both.
- The use of the model (first column) is simple, start with the intercept then multiply the other the coefficients with their interrogation values and add everything together. Use it to gamble at your own peril. Until such a time as you can accurately predict end of year stats for these categories, the model is only good for using as a platform to base sophisticated guesses off of.
-
Probable influential factors that are embedded in the 25% of the variation not explained by the model (1 – R_squared) are:
- Return Teams effectiveness. Good return teams will establish good field position thus reducing OffYds/G.
- Coverage Teams effectiveness. Bad units will allow the other team to establish good field position thereby reducing DefYds/G.
- Field Goal Kicking effectiveness. If you get into field goal position and miss, you’ll have a lot of yards but nothing to show for them.
- Penalties. Penalty yardage will increase/decrease your production depending on if they’re called on you or them but doesn’t necessarily change how effective each team is at controlling field position.
- In round terms, factor influence on winning percentage breaks down to 30% Offense, 30% Defense, 15% Turnover Margin, and 25% Other Things.
Shine Down on the Big Ten (and it’s self-absorbed neighbor)
Below is 2009 Big Ten Data and Blue Moon Model expectation (BMM Expect).
| Team | OffYds/G | DefYds/G | TrnOvrMgn_Tot | 2009 Wins | BMM Expect. | Delta Wins |
| Ohio St. | 364.8 | 262.5 | 17 | 11 | 11 | 0 |
| Penn St. | 412.5 | 277.1 | 6 | 11 | 10 | 1 |
| Iowa | 330.8 | 286.7 | 2 | 11 | 8 | 3 |
| Wisconsin | 415.8 | 310.4 | 3 | 10 | 9 | 1 |
| Northwestern | 386 | 344.3 | 4 | 8 | 8 | 0 |
| Michigan St. | 407.1 | 364.3 | -6 | 6 | 7 | -1 |
| Minnesota | 295.8 | 364.3 | -1 | 6 | 5 | 1 |
| Notre Dame | 451.8 | 397.8 | 5 | 6 | 7 | -1 |
| Purdue | 391.3 | 376.6 | -5 | 5 | 6 | -1 |
| Michigan | 384.5 | 393.3 | -12 | 5 | 5 | 0 |
| Indiana | 365 | 401 | 7 | 4 | 6 | -2 |
| Illinois | 393.5 | 403.3 | -4 | 3 | 5 | -2 |

[Ed.: Many excellent diaries of late that all but demand bumps. Larsonlo's Football Fundamentals 101 series is a must-read that will hit the front page at some point and the Mathlete's back, plus Misopogon is analyzing Cam Gordon in crushingly detailed fashion. Here's a quick one that hints at the QB duel winner.]
The quarterback is obviously the single most important position in Rich Rodriguez's offense, so I decided to take a look at some numbers from his time at West Virginia up until this past season at Michigan. What I found, while not exactly scientific, is pretty damn interesting.
Before I get to the summary, let's take a look at the charts... [ed: charts.]
West Virginia QB Charts
|
Year
|
Record
|
Player
|
Passing
|
Rushing
|
QB Rush%
|
Rush % Total
QB yds
|
Total Team
Offense Rush %
|
|
2001
|
3-8 (1-6)
|
Brad
Lewis
|
135/237
1,339yds
7TDs, 9INTs
|
54att,
41yds,
1 TD
|
18.6%
|
2.97%
|
52.4%
1,992 Rushing
1,811 Passing
|
|
2002
|
9-4 (6-1)
|
Rasheed
Marshall
|
139/259
1,616yds
9TDs, 5 INTs
|
173att,
666yds,
13 TDs
|
40.0%
|
29.2%
|
67.8%
3,687 Rushing
1,753 Passing
|
|
2003
|
8-5 (6-1)
|
Rasheed
Marshall
|
109/215
1,729yds
15 TDs, 8 INTs
|
101att,
303yds,
4 TDs
|
32.0%
|
14.9%
|
57.6%
2,762 Rushing
2,034 Passing
|
|
2004
|
8-4 (4-2)
|
Rasheed
Marshall
|
144/242
1,886yds
19 TDs, 9 INTs
|
169att,
861yds,
4 TDs
|
41.0%
|
31.3%
|
60.4%
3,034 Rushing
1,993 Passing
|
|
2005
|
11-1 (7-0)
|
Pat White
|
65/114
828yds
8 TDs, 5 INTs
|
131att,
952yds,
7 TDs
|
53.4%
|
53.5%
|
73.2%
3,269 Rushing
1,398 Passing
|
|
2006
|
11-2 (5-2)
|
Pat White
|
118/179
1,655yds
13 TDs, 7 INTs
|
165att,
1,219yds,
18 TDs
|
47.9%
|
42.4%
|
65.7%
3,939 Rushing
2,059 Passing
|
|
2007
|
11-2 (5-2)
|
Pat White
|
144/216
1,724yds
14 TDs, 4 INTs
|
197att,
1,335yds
14 TDs
|
47.7%
|
43.6%
|
65.1%
3,864 Rushing
2,067 Passing
|
Michigan QB Charts
|
Year
|
Record
|
Player
|
Passing
|
Rushing
|
QB Rush %
|
Rush % Total
QB yds
|
Total Team
Offense Rush %
|
|
2008
|
3-9 (2-6)
|
Steven
Sheridan
|
165/338
1,718yds
11 TDs, 12 INTs
|
118att,
293yds,
3 TDs
|
25.9%
|
14.6%
|
50.8%
1,771 Rushing
1,718 Passing
|
|
2009
|
5-7 (1-7)
|
Denard
Forcier
|
179/312
2,233yds
15 TDs, 14 INTs
|
187att,
591yds,
8 TDs
|
37.5%
|
21.0%
|
48.4%
2,234 Rushing
2,380 Passing
|
|
Year
|
Rush %
Total QB Yards
|
Record
|
| 2005 | 53.5% | 11-1 (7-0) |
| 2007 | 43.6% | 11-2 (5-2) |
| 2006 | 42.4% | 11-2 (5-2) |
| 2004 | 31.3% | 8-4 (4-2) |
| 2002 | 29.2% | 9-4 (6-1) |
| 2003 | 14.9% | 8-5 (6-1) |
| 2001 | 2.97% | 3-8 (1-6) |
Throwing the two seasons at Michigan into the mix wouldn't change much, either. The 2008 and 2009 campaigns would be two of the bottom four performances in terms of how many of the quarterback's yards came on the ground and two of the bottom three in terms of overall record.
Even beyond just the quarterback's performance in the offense, however, Rich Rod's offenses seem to thrive when the majority of the overall offense is primarily generated on the ground. From his last nine seasons:
|
Year
|
Total Team Offense Rush %
|
Record
|
|
2005
|
73.2%
|
11-1
(7-0)
|
|
2002
|
67.8%
|
9-4
(6-1)
|
|
2006
|
65.7%
|
11-2
(5-2)
|
|
2007
|
65.1%
|
11-2
(5-2)
|
|
2004
|
60.4%
|
8-4
(4-2)
|
|
2003
|
57.6%
|
8-5
(6-1)
|
|
2001
|
52.4%
|
3-8
(1-6)
|
|
2008
|
50.8%
|
3-9
(2-6)
|
|
2009
|
48.4%
|
5-7
(1-7)
|
And these aren't even necessarily based on the quality of the team. If this was ranked on team total rushing yards it would make sense that more yards would generally be correlated to a better record, but these are rushing percentages compared to the rest of the offense on a year-by-year basis, comparing one aspect of the team to another aspect of the same team.
Very interesting findings, if you ask me. Findings that point to Denard Robinson being the ticket to the promised land? Maybe. Clearly Rich Rodriguez's offense flourishes with a quarterback that can run, and run often. His best team had 73% of their total offense come on the ground. Its quarterback ran for 125 more yards than he passed for. Sounds like Denard to me.
Also notice that after White's first season--in which passing was sporadic and the team was heavily reliant on his rushing offense--his passing stats took off. As Denard's passing game develops, his rushing options will open up more, and as Steve Slaton got to experience, this opens the door for an unbelievable rushing attack from your running backs as well.
Agree? Disagree? Let me know what you see in these stats, or if they even matter to you at all. I look forward to hearing what you get out of these numbers. [Ed: /Ives.]
Thanks for reading,
CollegeFootball13
[Ed: meant to bump this sooner but there was a lot of stuff yesterday.]
After the disastrous offensive performance of 2008, the 2009 Wolverine offense really had nowhere to go but up. Using my offensive ratings, the 2008 Michigan offense was 7.4 points per game below average, 107th out of 120 FBS teams. 2009 brought another year in the system and real quarterbacks and huge improvements. While far from consistently excellent, Michigan moved up to a modest 1.2 points per game above average, 50th nationally. No one outside of the eternal optimists like Fred Jackson could see another 57 place ranking improvement, but what has happened to teams that have shown big offensive improvements in year in the following year.
Presently my database has the 2007-2009 years completed, just enough for a 3 year case study. From 2007 to 2008 there were 28 teams that improved offensively by at least 5 points per game. I broke those team into three categories, teams that saw a second major (+5) increase in the third year, teams that saw a major (-5) regression back in the third year and teams that were in the middle and didn’t necessarily continue gaining, but didn’t fall back much either.
The Regressers
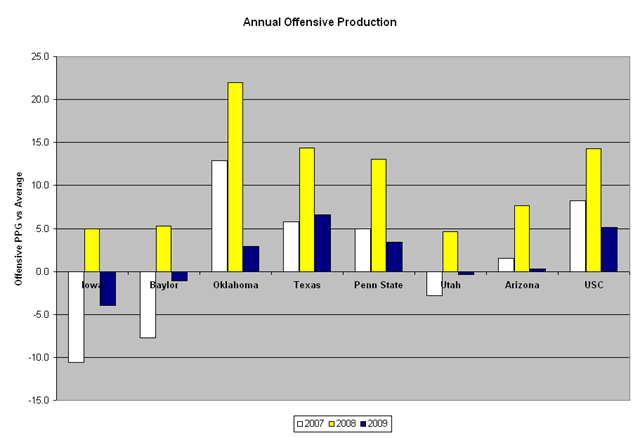
*Only BCS teams shown
With 14 of the 28 teams in this group, half of the teams that show big gains can expect a return to the mean the next season. In fact, these teams were worse offensively in 2009 than they were in 2007, let alone the beacon season of 2008. The average team in this group was 2.5 points per game worse in 2009 than they were in 2007 before they peaked.
The closest thing to a consistent thread is the quarterback possession as five of the eight, Oklahoma, Baylor, USC, Arizona and Utah, spent most or all of the season with a new quarterback.
In general, the regressers look like a group that is just regressing to the mean and that replacing a quarterback is damaging when your success has not been sustained for longer than a single season.
The Holders

With the exception of Alabama, these teams were pretty average in returning starts and had no major position group gaps to fill. Alabama had a new quarterback and was 97th in returning offensive starts nationally, the ability to sustain the offensive success is likely attributable to the influx of talent Saban brought into Alabama since he arrived.
The Gainers
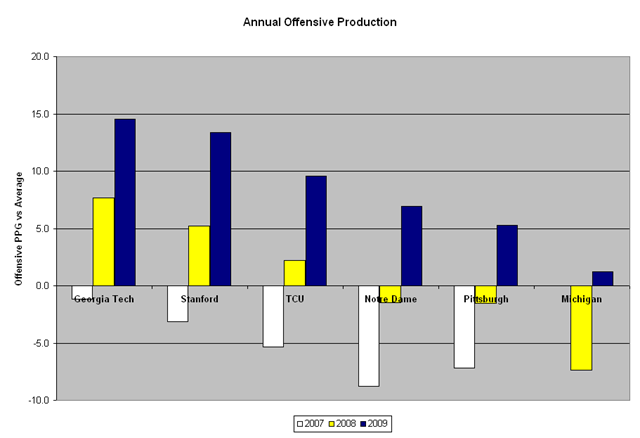
*Michigan 2007 results omitted (-1.1)
With a relatively new coach and a total offensive system overhaul, Georgia Tech is clearly the most similar situation to Michigan and their path is one that Michigan would be thrilled to follow. Tech went from –1.1 ppg in 2007 to 7.6 in 2008 to 14.5 and my top rated offense in the country in 2009. Even though Johnson and Rodriguez were hired the same year, the Michigan offense is about 2 years behind Georgia Tech. Georgia Tech went from average to very good to best in the country. Michigan went from average, to very bad and back to average. Even with the offset timeline, Michigan seems comparable to Georgia Tech’s situation and therefore a second year of offensive gain seems very possible under this comparison.
All five of these teams either returned 20+ starts at the quarterback position (except GT who had the same quarterback from the start of the system), although Stanford’s returning quarterback was replaced. The other major similarity between these schools in neither of the last two years did they have stratospheric gains, there is less flukiness to these teams success.
When looking at the progression from very bad to roughly average, there are four BCS level schools who showed that same progression. Three of those (TCU, Notre Dame and Pittsburgh went on to see big gains in year 3 as well, and NC St still saw modest improvement. Teams fitting this profile for a potential second year of strong offensive progress in 2010 along with Michigan include Kentucky, UConn, Wake Forest and Mississippi St.
Conclusions
Although teams that show a big jump like Michigan last year are more likely to fall back than continue the progress, the recruiting profile, experience at quarterback (even if the returner loses his job), progressions comps and system change all point to Michigan as being a good candidate to at least sustain and probably show more improvement next year. Every 3 point gain is worth about one additional win on the season and based on this look I would say that from the offense alone, a 3 point gain seems likely and a 6 point gain entirely possible.
77