B1G Expectations - 2021 Week 4 Total Conference Wins Outlook

2021 Week 4 Total Conference Wins Outlook
“Many a time of an evening, when I sat alone looking at the fire, I thought, after all, there was no fire like the forge fire and the kitchen fire at home.”
- Pip
(Great Expectations by Charles Dickens)
Spin Up
Just in case you haven’t noticed, Michigan’s 4-0 record just so happens to match its home versus away game count. Is this only a coincidence?
From a pure points point of view, the sharps would argue that home-field advantage is a nominal 3 point margin attributable to the home team. But in certain circumstances, it can sure seem like that advantage is a whole lot more. Certainly, your average PSU fan would contend that the “White Out” yields more than the standard advantage for the Nittany Lions. Similarly, UM has already made use of its own night-game differentiator - the “Maize Out” - to seek out an advantage over the Washington Huskies this season. The visiting team locker room at Kinnick Stadium is painted a soothing shade of pink to give the Hawkeyes an extra edge for every home game. The point in all of these escapades is to create as hostile an environment as possible for the opponent. So there’s that. But there’s also this. Coming up for Michigan is the first road game of the season, and it’s not Minnesota or Northwestern or Indiana. It’s Wisconsin - Camp Randall - a place where UM has not won a football game in 5 tries over the last 20 years. So here Team 142 stands, on the precipice of its first road game of the season, a foray into the Heart of Darkness that is Madison, Wisconsin.
So, you know what? It’s a good thing that in the second half of last week’s game against Rutgers, Rutgers came out and punched Michigan in the mouth. The reason is that maybe that’s just what Michigan needed to remind them that this is the Big Ten they’re playing in now, and they’d better wake the #&*% up! Hopefully, the results of that narrow escape will leave this team more focused and more prepared to play a complete 60 minutes of football, and to win with cruelty - to win, with extreme prejudice.
Of course, no one ever plays anyone else until…they do. And so that’s why there are computery, fancy stats sorts of things to try to conduct both a statistically sound and logically robust analysis of the vast dataset that is play-by-play statistics beyond just the relatively sparse dataset consisting of game scores. Such is the nature of Bill Connelly’s S&P+ (now at ESPN), as well as ESPN’s own FPI (like S&P+, but “different”). These two rating systems form the baseline for this report. However, just for kicks and for the sake of comparison, the older-school Pure Points model provided by Jeff Sagarin is included in this report.
Schedules, Spreads & Win Probabilities
So, with that, it’s on to a multiple ratings analysis. The focus is on the all-important in-conference slate so as to better illuminate the prospects for each of the teams to make it to the B1GCG in Indy, and beyond. But before delving into the details of applying the ratings to the schedules, let’s first have a look at the ratings themselves across the conference. All three ratings are points-based, but only S&P+ and FPI are relative to an average FBS team.
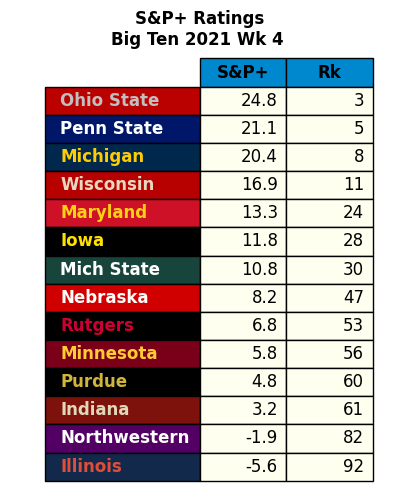
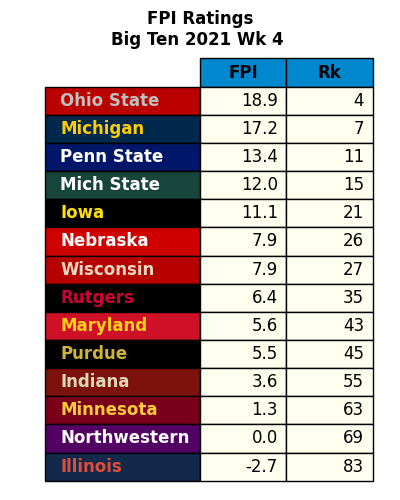

Some interesting shifts have occurred in the CFB ratings since week 3, with the only consistent placements from week-to-week and rating-to-rating being the two teams at the bottom with average-or-below ratings: Northwestern and Illinois. Minnesota is trending to join them there, whereas perennial bottom-feeder Rutgers has established a foothold in the middle ground. Alas, the mighty Buckeyes have been displaced from their immutable position at the top of at least one rating, on account of your Ever-lovin’ Maize’n’Blue having usurped the #1 spot in the Sagarin ratings. Meanwhile, the Hawkeyes are not getting much love from the fancy stats, being rated as low as 6th-best by S&P+, behind twice-beaten Wisconsin. Sparty lays claim to the most widely varied position, ranging from as high as 4th in the FPI to as low as 10th in the B1G as per Sagarin.
B1G East Schedule Rundown
The tables below are composites of the conference schedules for all seven teams in the B1G East with the latest ratings following the games week 4. The last table in each set simply shows a rank-ordering of the B1GE teams based on their expected in-conference win totals - it’s not a projection of divisional standings based on projected wins, losses, and tie-breakers. Those are found in a later section.
S&P+ Results

Once again, the top three teams in the expected wins standings are the usual suspects: OSU, PSU and UM, in rank order. However, the separation among the three has expanded from 0.7 to 1.1 wins, with OSU now being favored in all of its remaining games. Meanwhile, PSU is favored in all of its games except when they visit the Horseshoe, where the Nits will be a 6.7 point underdog (33.3% win likelihood or about 1:2 odds). And so it goes, UM is the underdog in two of its games, on the road at Happy Valley as as when the Buckeyes visit the Big House.
The outlook offered by S&P+ for MSU puts Sparty in the same strata as the Terps, both of whom are expected to win a total of 5.0 games (up from 4.3 wins). This puts them both relatively out of B1GE divisional contention, but still well within the bowl-eligibility bubble. Nonetheless, both teams are expected to have winning B1G records, and the game-by-game spreads reinforce that.
The Hoosiers, however, have ridden a steady downward spiral to the bottom of the expected wins standings. It only promises to get worse for the Hoosiers before it gets better, as they stare down a scheduling gauntlet that has all of their B1GE divisional opponents in a row, beginning at Happy Valley on Saturday, where they will be a 20.9 point underdog (1:10 odds) to the Nits.
FPI Results

With the exception of OSU at the top, Rutgers in 6th place and Indiana at the bottom, FPI shakes things up a little bit relative to S&P+ in its expected wins standings. The Terps have slid ahead to 5th place and into sole occupancy of the B1GE Bowl-eligibility Bubble. Otherwise, the S&P+ ratings are forecasting some serious carnage in contention for the Indianapolis Invitation. Michigan, PSU and MSU are all within 1.1 expected wins of OSU, with UM only 0.4 wins behind the Buckeyes, who lead them all with 6.8 expected wins. In contrast to S&P+ however, OSU is not the favorite in all of its remaining games. Indeed, FPI shows OSU as a 1.3 point underdog (down from 1.7 points last week) in only one of its games… the one at the end of its schedule. The only team that FPI expects to win out is Michigan! This of course means that PSU and MSU are both underdogs to UM. In addition to UM and OSU, PSU is an underdog to Iowa and MSU as well. So not much love for the Nits coming out of FPI these days.
Sagarin Results

The Sagarin ratings currently project three main contenders led by UM with 6.7 expected wins, followed by OSU 0.2 wins back, and PSU at about 5.6 expected wins. MSU is marginally in contention, 2.1 wins behind UM at 4.6 expected wins. Like FPI, Sagarin projects only one team to win all of its remaining games, and that team is Meeechigan! Sagarin also has OSU as the underdog in only one of its games - the one at the end of its schedule - by a whopping 4.3 point margin. The Nits turn out to be an underdog in three of their remaining games according to Sagarin, by 5.9 points when they visit Kinnick Stadium on October 9, and by 7.1 points when they visit the Horseshoe, and by 2.4 points when UM comes to visit Happy Valley.
Meanwhile, even though Sparty registers 4.6 expected wins - enough for a marginally winning record - Sparty is actually the underdog in all but one of its remaining games, albeit four of them are by margins of less than one score. Sagarin is in agreement with S&P+ and FPI in so far as the Hoosiers are the projected bottom dwellers, but by contrast puts Rutgers in the 5 spot and Maryland in 6th in terms of expected wins.
B1G West Schedule Rundown
The next set of schedule tables shows the conference schedules for all seven teams in the B1G West based week 4 results and ratings for the remaining games from S&P+, FPI and Jeff Sagarin’s Pure Points ratings. Again, the last table in each figure simply shows a rank-ordering of the B1GW teams based on their expected win totals - it’s not a projection of divisional conference standings per se. Those projections can be found in the next section.
S&P+ Results
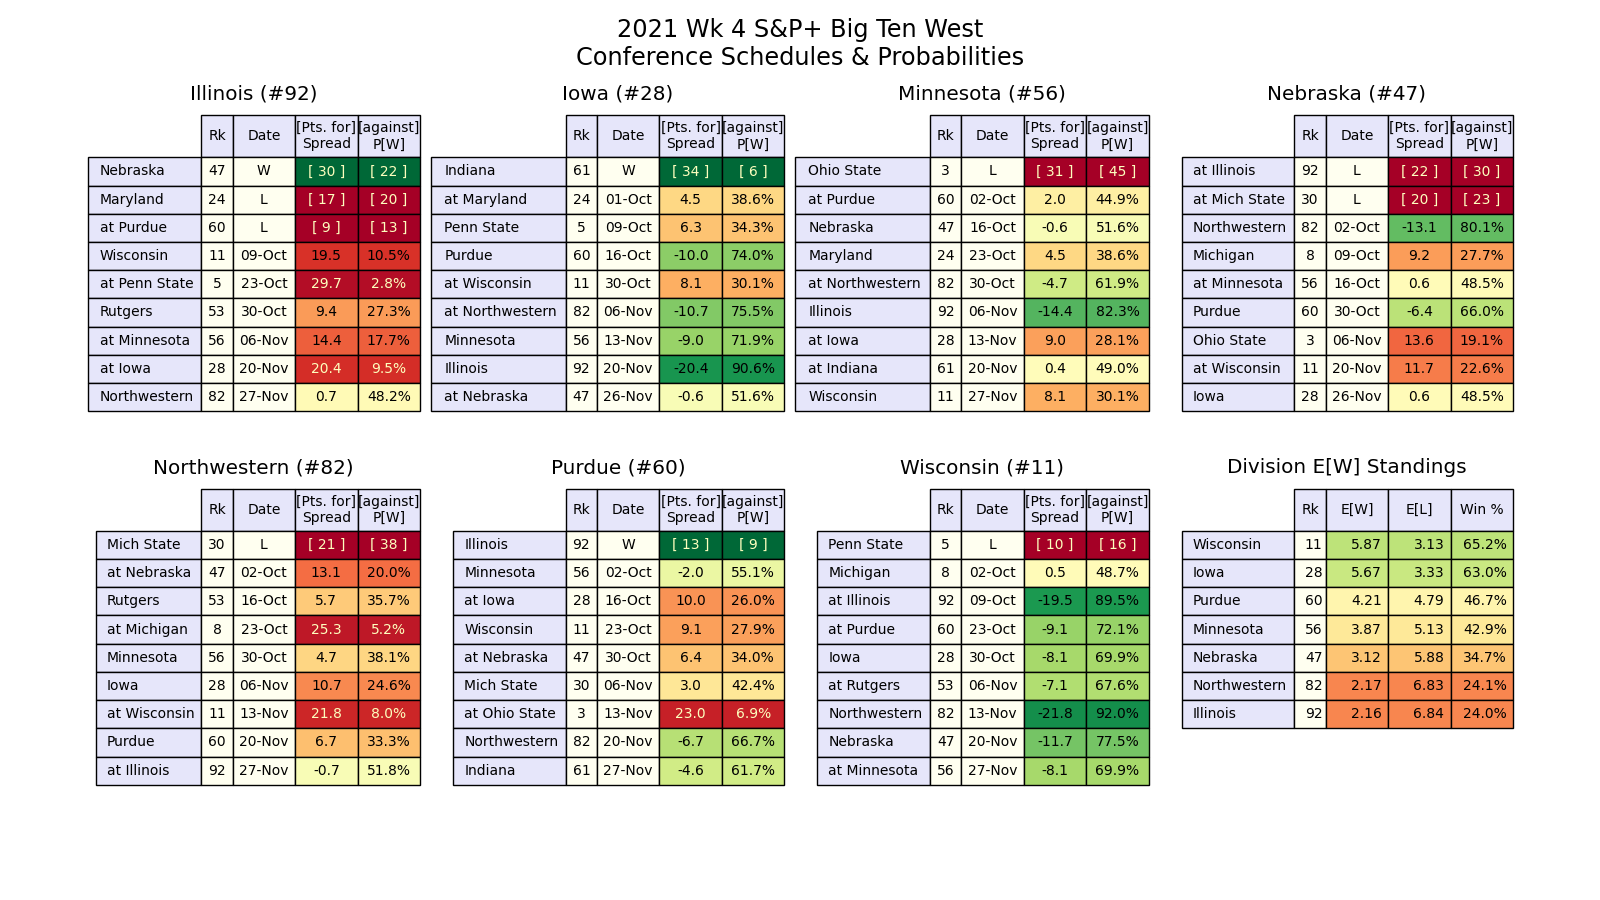
As for the B1G West, S&P+ continues to show that the race to Indy is essentially between two contenders (Iowa and Wisconsin), but by the strictures of this diary, Purdue is within 1.7 expected wins of the top and so can be considered a dark horse contender. Wisconsin has somehow managed to take the B1G@ lead with 5.9 expected wins, edging the Hawkeyes by 0.2 wins. What’s more, the Badgers are favored by a whopping -8.1 point margin (7:3 odds) when the Hawkeyes come to visit Camp Randall on October 30. This puts the Badgers in the catbird seat despite their being a 0.5 point underdog when they play host to Michigan this weekend. As it stands as of now, S&P+ is so enamored with the Badgers, that they could drop the Michigan game and still have a favorable path to the B1GW Invitation to Indy. The reason being that Iowa is remarkably an underdog in 2 other games (Maryland by 4.5 points and PSU by 6.3 points) in addition to the tussle with the Cheese Eaters.
As for the rest of the B1GW, Purdue, Minnesota and Nebraska remain in the Bowl-eligibility Bubble, but Purdue and Minnesota will need to win at least one game in which it is currently an underdog; Nebraska will need to win two such games. It goes without saying that none can afford to drop a game in which they are favored. Meanwhile, Illinois and Northwestern have settled to the bottom, with the Illini being the bottom-most.
FPI Results
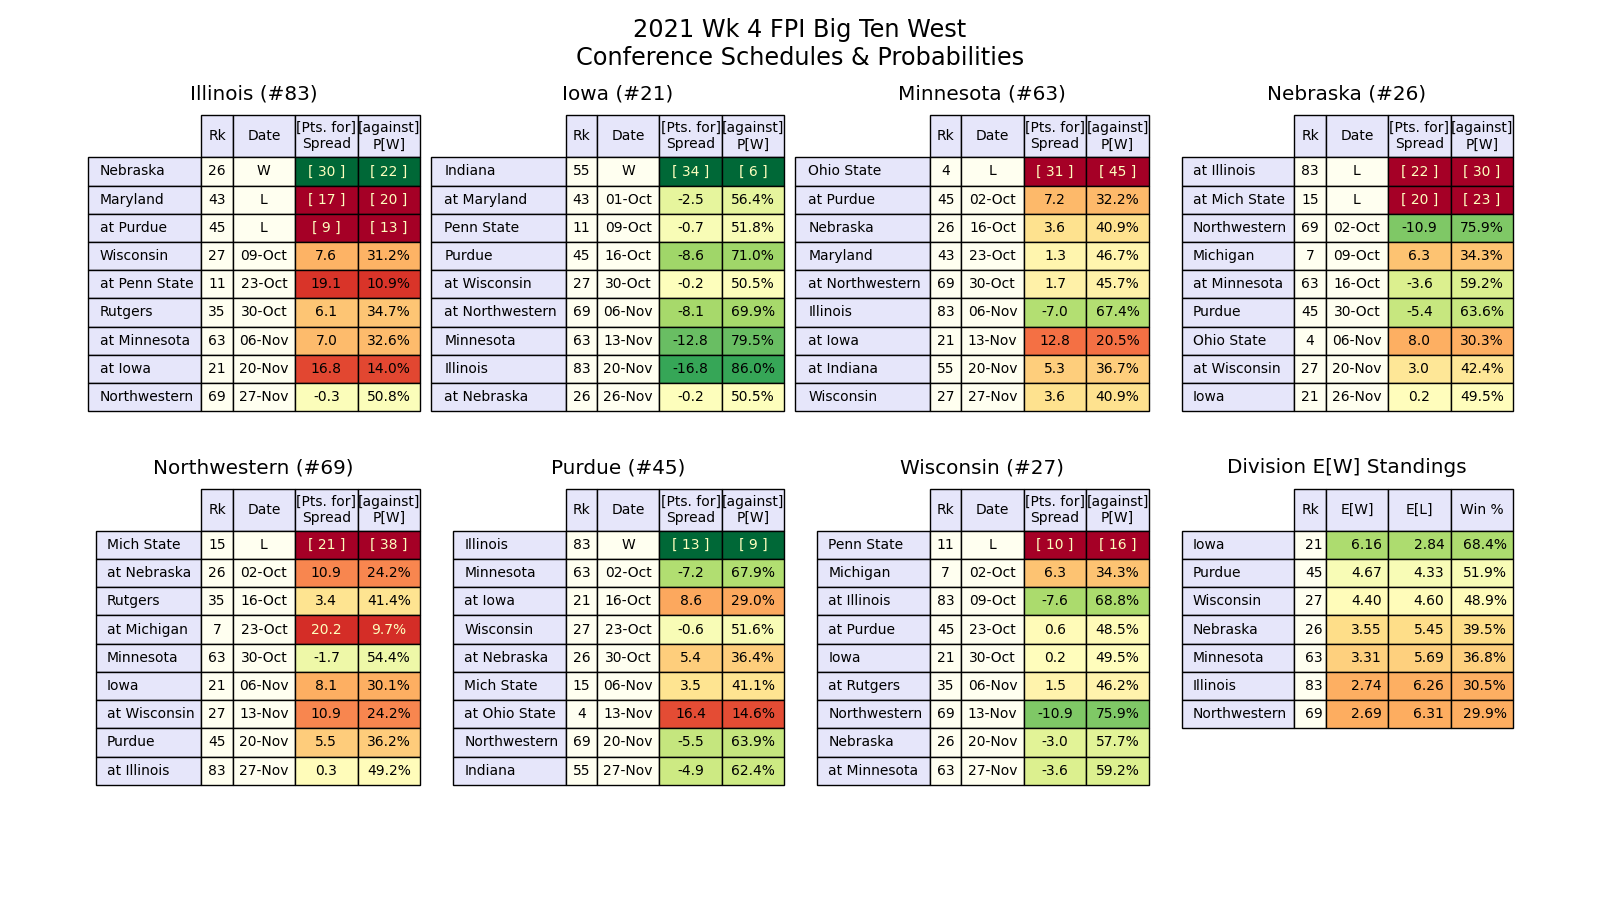
The FPI on the B1G West keeps Iowa well ahead in the lead at 6.2 expected wins, 1.5 wins ahead of resurgent Purdue, who has inched ahead of Wisconsin by 0.3 wins to expand the B1GW race to 3 teams. Unlike S&P+, FPI now sees the Badgers as the underdog to the Hawkeyes, but by a very slim 0.2 point margin (1:1 odds). What’s more, the Badgers are also the underdog (6.3 point margin, or 1:2 odds) when they play host to Michigan. Meanwhile, S&P+ has the Hawkeyes favored in all of their remaining games, putting them on a path to an undefeated regular season, but will have 3 matchups with margins of less than 1 point: PSU, at Wisconsin and at Nebraska.
At this point, the B1GW Bowl-eligibility Bubble as per FPI consists of Nebraska and Minnesota, with Nebraska needing to win 2 games in which they’re the underdog; and Minnesota, 3 games. Both are at about 3.5 expected wins, so the chances for either to make it to a bowl are 50/50. Meanwhile, FPI agrees with S&P+ insofar as Illinois and Northwestern are in a race to the bottom of the standings, with NU in the lead.
Sagarin Results
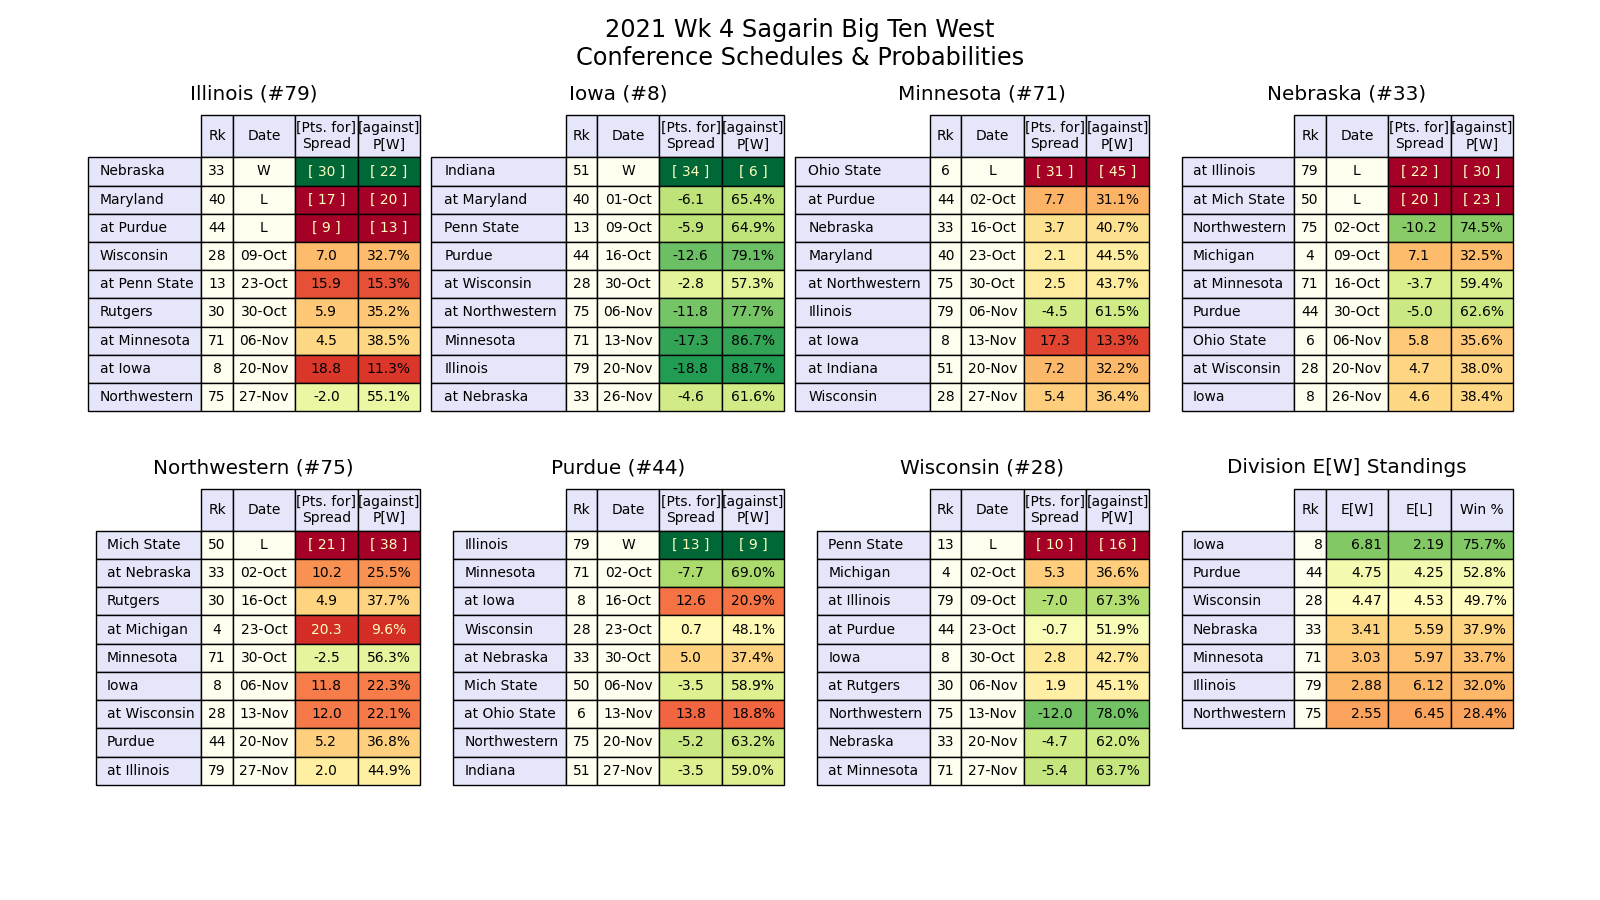
The Sagarin ratings also show Iowa as the clear leader in the B1GW at 6.8 expected wins, more than 2 wins ahead of next-best Purdue. At 2.3 wins behind Iowa, Wisconsin is practically out of contention. Like the FPI, Sagarin also projects Iowa to win all of its remaining games. It’s narrowest margin is -2.8 points in the tussle with the Badgers. Meanwhile, the Badgers are underdogs in 3 of its remaining games, including its game hosting Michigan (by a 5.3 point margin). The Boilers will likely split their remaining games, but are only a 0.7 point underdog when the Badgers visit West Lafayette.
The B1GW Bowl-eligibility Bubble is rounded out by Nebraska. The Huskers will need to pull an upset in at least one of its remaining games. The Gophers are looking more likely to miss a bowl game this year, with an expected win total that is approaching the depths of Illinois and Northwestern.
Expected Conference Wins Distributions
Before getting into the projected final standings, it’s worth having a look at the distributions of expected wins across the conference. If nothing else, it serves as a reminder that point spreads are subject to very wide statistical variations (two standard deviations is +/- 34 points), wide enough to account for just about anything happening!
The plots below show the expected total conference wins distributions for the teams in each division. The legends list the teams in order of decreasing expected win totals. The expected win total is determined by the value at which half of the area under the curve is to the left, and the other half is to the right! The number of wins with the highest probability (i.e. the most likely outcome) for a given team is referred to as the “mode”.
S&P+ Results
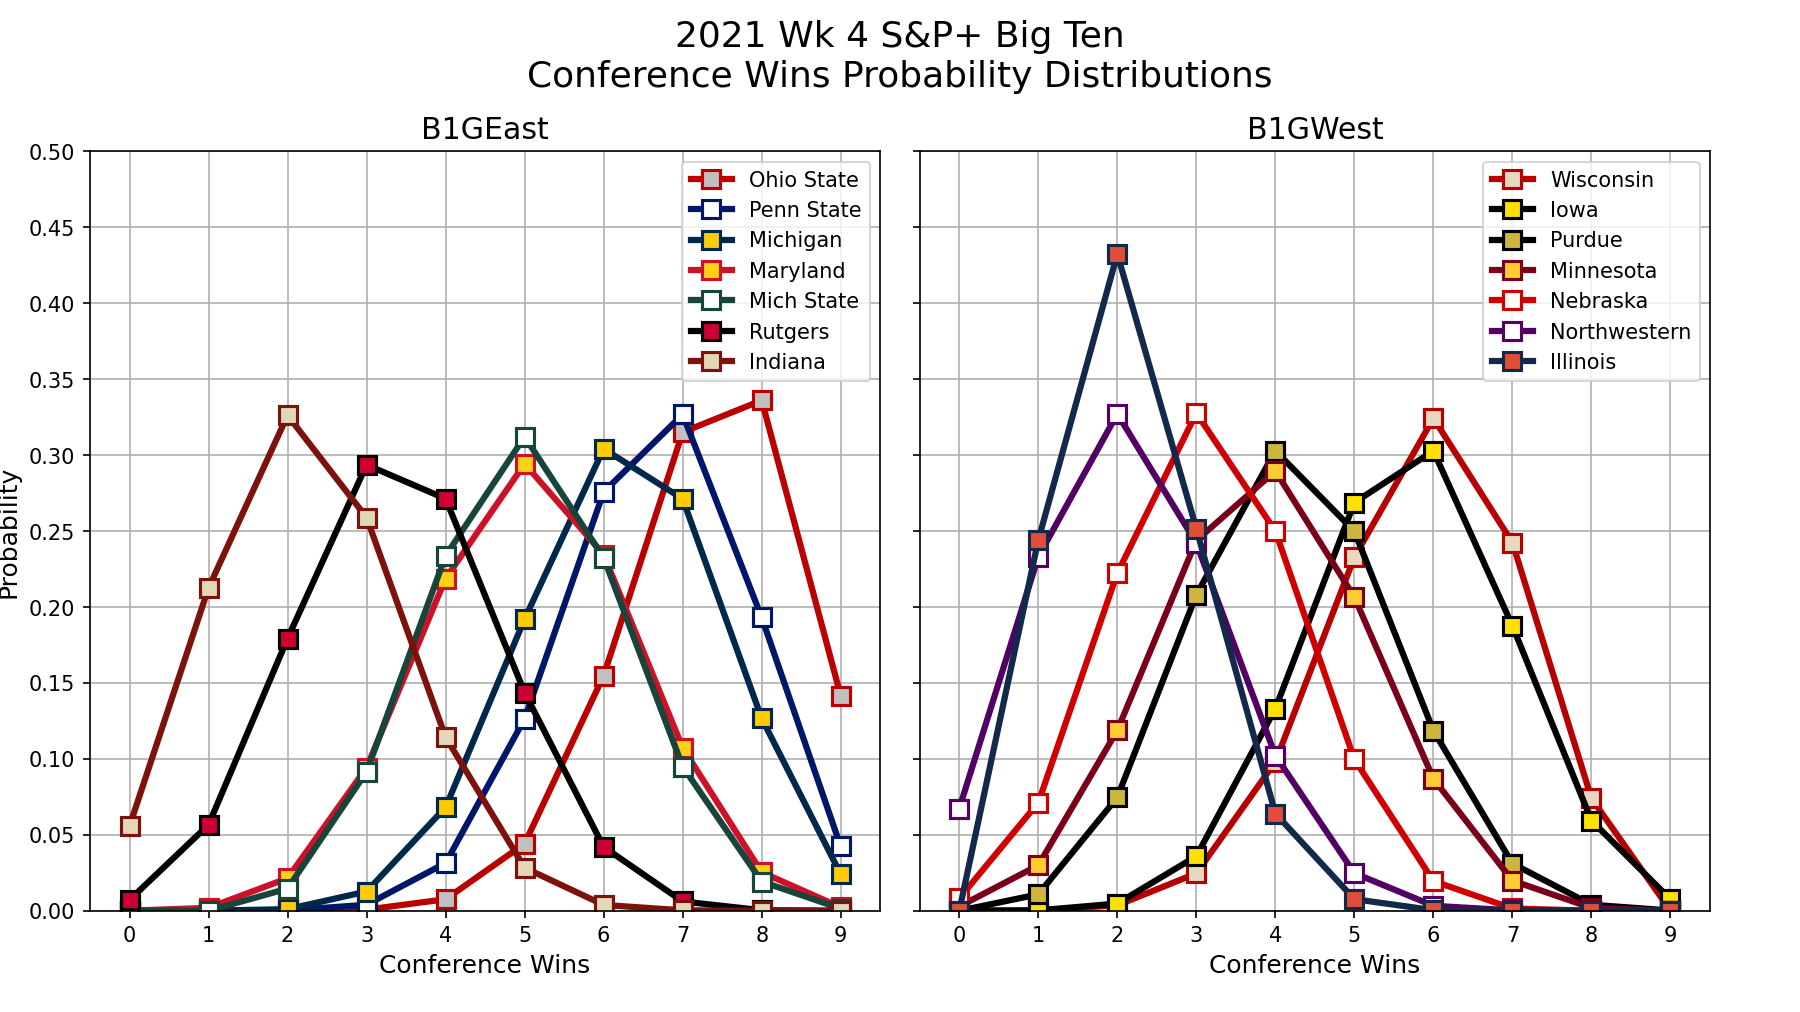
What a difference a week makes! The S&P+ distributions now show some separation among the three contenders in the B1GE. UM, PSU and OSU now occupy the 6, 7 and 8 win modes respectively. However, both OSU and UM distributions are biased toward the 7-win mode in the middle. OSU has the best chance of going undefeated in the B1G at just above 14%, while PSU and UM are at 4.2% and 2.4%, respectively. On the other side, the competition in the B1GW - though limited to only Wisconsin and Iowa, remains tight. Both Iowa and Wisconsin have fairly balanced modes of 6 wins each. Iowa is the only team with a chance of going undefeated in the B1G, but it is vanishingly small.
Also clearly delineated are the distributions of the Bowl-eligibility Bubble teams. In the B1GE, the distributions of Maryland and MSU remain quite similar and balanced on a 5-win mode. Meanwhile, Rutgers is creeping into the Bowl-eligibility region with a 3-win mode that is strongly biased toward 4 wins. Alone as the solitary B1GE Bottom Feeder: poor damn Indiana. The B1GW Bubble teams are more closely grouped with the Gophers and Boilers sharing a 4-win mode, while the Huskers have a balanced 4-win mode. As for the Bottom Feeders, the Cats and Illini are hunkered down in modes of 2 wins apiece.
FPI Results

You may have to squint your eyes a bit, but the FPI chart for the B1GE shows four contenders in a loose grouping aligned on the 6-win and 7-win modes. The MSU distribution is nearly indistinguishable from PSU, but it’s there and they both share the 6-win mode. Meanwhile, UM straddles between the 6 and 7-win modes, with OSU being the sole team with a 7-win mode. OSU has the best chance of going undefeated in the B1G at 7.1% (down from 7.6% last week), followed by UM at 3.7% (up from 3.3%) and PSU at 1.0% (down from 1.7%). MSU’s chances are vanishingly small. On the other side, Iowa remains the clear favorite. The Hawkeyes are sitting pretty with a mode of 6 wins biased strongly toward 7 wins. In fact, the Iowa distribution is somewhat similar to UM’s. Meanwhile, Wisconsin is joined by Purdue in straddling between the 4-win and 5-win modes, with the Boilers on the high side and Badgers on the low.
Regarding the Bowl-eligibility Bubble teams in the B1GE, the Maryland-Rutgers matchup may be the one that bursts the bubble for the loser, as the distributions for both teams are nearly identically balanced on the 4-win mode. Indiana is clinging to a 3-win mode that is biased toward only 2 B1G wins, so their chances of becoming bowl-eligible still stand at about 28%. So, it may still be possible that all teams in the B1GE become bowl eligible. The B1GW Bubble teams - Minny and Nebraska - are straddling between the 3-win and 4-win modes. Meanwhile, as with the S&P+ results, the Cats and Illini are well-established Bottom Feeders. Although, it should be noted that the Cats, like the Hoosiers, have 2 OOC wins, which gives them a 26% chance to become bowl-eligible.
Sagarin Results
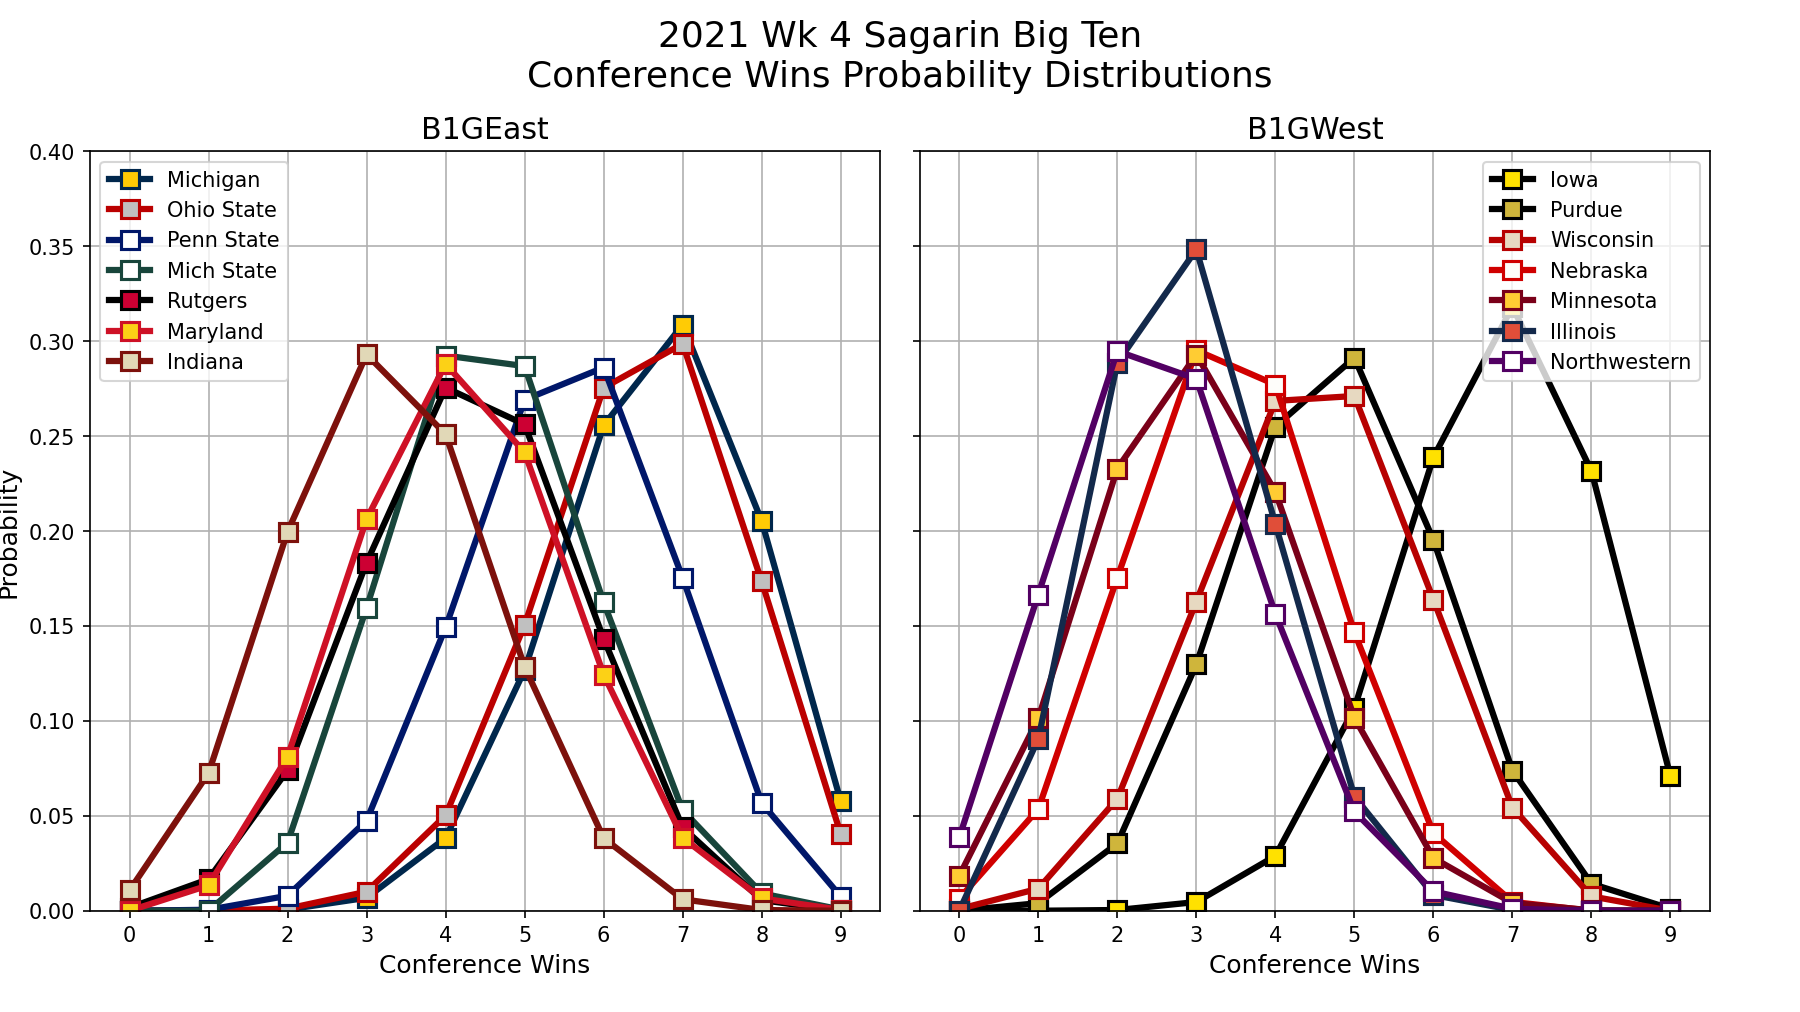
The Sagarin results have become rather interesting! In the B1GE, the three contenders - UM, OSU and PSU - are grouped between the 6-win and 7-win modes, with OSU and UM sharing the 7-win mode. With OSU slightly more biased toward 6 wins than UM, which is more balanced on 7 wins. PSU, meanwhile, has a strong bias toward 5 wins, largely due to their having to face Iowa at Kinnick.
On the other side, Iowa is once again the clear favorite, standing alone with a solid 7 win mode. Practically relegated to the Bowl Bubble are Purdue with its downward-tilting 5-win mode and Wisconsin, straddling between the 4-win and 5-win modes. Nebraska is still holding onto a very hopeful 3-win mode that is strongly biased toward 4 wins.
Meanwhile, the Illini have a very prominent 3-win mode, but with 2 OOC losses, their hopes for bowl eligibility remain fleeting. Likewise, the Cats 2-win mode is not a great complement to their two OOC wins, leaving them with about a 22% chance at bowl-eligibility.
B1G Expected Final Standings
As alluded to above, following are projections of the divisional conference standings at the end of the season based on the combination of current records and the projected wins and losses for the remainder of the season.
S&P+ Forecast

FPI Forecast

Sagarin Forecast

Based on simple point-margin enforced wins and losses, the S&P+ ratings forecast OSU to win the B1GE with a 9-0 conference record, while FPI and Sagarin hold that Michigan wins the B1GE, also with an 9-0 record. At this juncture, The Game does not look to be the determining event in the B1GE according to S&P+, as OSU will have likely clinched a trip to Indy before heading to Ann Arbor. However, The Game will be all-important when considering the FPI and Sagarin ratings, and both teams could be unbeaten in B1G play heading into the game.
As for the B1GW, the S&P+ ratings project a 7-2 (9-3) Wisconsin team to earn a trip to Indy, beating out a 6-3 (9-3) Iowa team. In contrast, FPI and Sagarin see a 9-0 (12-0) Iowa running away with it over a next-best 5-4 (7-5) Purdue squad.
The biggest differentiators among all of the ratings appears to be the assessments of the Iowa Hawkeyes and Penn State Nittany Lions by S&P+. Because S&P+ has the Hawkeyes rated comparatively low, and Penn State comparatively high, it provides both Penn State and Wisconsin wins over both Michigan and Iowa, which is sufficient to propel the Badgers to Indy, and drop UM to 3rd place in the B1GE.
Yours in football, and Go Blue!
September 30th, 2021 at 11:40 PM ^
Damn! That's some work.... will have to read and digest it more thoroughly when I have a bit more time (ie. not at work).
Cheers
October 1st, 2021 at 11:22 AM ^
Lots of effort there, but these tools are more appropriately used to analyze the past than to predict the future. It's especially silly to talk about "expected to win out" or equivalent. Winning out percentages are rarely higher than the teens. That's hardly something "expected," as your own "distributions" graphics show in the last section.
It's that last section—wins probability distributions—that I found most helpful. Thank you!
October 1st, 2021 at 1:36 PM ^
Is there any other choice but to analyze the past?
As far as predicting the future goes, if there is a point margin established between two teams prior to their competition, that margin is a prediction. This analysis uses a snapshot of all of those relative margins as the basis to predict outcomes of all remaining contests, not just the next ones, in order to infer the complete cascade of outcomes that make up an entire season. To suggest the tools are not appropriate for predicting the future...
Obviously, a wide variety of outcomes is possible (imagine flipping a coin 10 times. How many heads or tails would you expect? How many actually occurred? Now repeat that test a 100 more times and record all the outcomes. What outcome did you see the most often?) That variety is the genesis of the distribution charts, which are comprised of Poisson-Binomial distributions.
Keep in mind that the term "Expected" and "Expectation" in the context of this analysis are the same as "Expected Value" as in any statistical analysis, where they imply a probabilistic likelihood. For example, when saying that OSU can be expected to win out, the likelihood of that occurring is about 14% as per S&P+ in the chart, and it's inferred that it's an 86% likelihood that they won't ...
The predicted standings are inferences of only the most likely outcomes, but that is not to exclude other outcomes from being possible - they're just less likely. Indeed, with so much football left to be played - the likelihood of any other set of outcomes occurring is far greater than the most likely one. And that's why they play the games.
October 1st, 2021 at 4:02 PM ^
Expected. Expectations. Expectorate.
(Impressive post. Thanks.)
October 1st, 2021 at 11:43 AM ^
This is wonderful.
Probably not a lot of us who think Michigan CAN'T win this game. That's why it will be an especially good litmus for the coaching staff and Harbs.
Get it the f done.
Comments