B1G Expectations - 2021 Week 3 Total Conference Wins Outlook

2021 Week 3 Total Conference Wins Outlook
“And the mists had all solemnly risen now, and the world lay spread before me.”
- Pip
(Great Expectations by Charles Dickens)
Spin Up
The first game of the B1G season is only a few days away, and the recruits of Team 142 are salty!
They are ready to eat their own guts and ask for seconds!
The coaches are proud to see that they are growing beyond their control!
Michigan does not want robots - Michigan wants killers!
Michigan wants to build indestructible men, men without fear!
When the recruits of Team 142 take the field on Saturday, they are no longer maggots!
On that day, they are Michigan Men!
Up first on the slate is Rutgers, but a version of Rutgers that is more like your father’s Rutgers than the LOLRutgerz with which you’ve become accustomed. Returning to Piscataway for the 2020 season was the prodigal coach, Greg Schiano, after galavanting about the country doing...prodigal things for prodigal organizations. You may recall that in Schiano's first contest versus Michigan, the Cable Subscribers lost to Michigan in a thoroughly forgettable triple-overtime affair. On the one hand, Michigan's 17-point comeback tied the third largest come-from-behind victory in program history and tied the second-biggest comeback on the road. On the other hand, last year’s near debacle only harkened back to the BPONE-14 pandemic and served as a damp, mildew-ridden blanket thrown atop the dumpster fire that was the 2020 season.
But hey, that was then, and at this juncture - three weeks into the 2021 season - Michigandom can begin to see that the obscuring clouds of preseason prognostications have begun to dissipate, only to be subsumed by the dubious powers of the transitive property. The mania behind the transitive property easily drives it to reveal tantalizingly seductive false equivalencies, not to mention prospects of untold game day glory. This may be a good time to take a deep breath and repeat the mantra, “Michigan ain’t played no one.”
Of course, no one ever plays anyone else until…they do. And so that’s why there are computery, fancy stats sorts of things to try to conduct both a statistically sound and logically robust analysis of the vast dataset that is play-by-play statistics beyond just the game scores and outcomes. Such is the nature of Bill Connelly’s S&P+ (now at ESPN), as well as ESPN’s own FPI (like S&P+, but “different”). These two rating systems form the baseline for this report. However, just for kicks and for the sake of comparison, the older-school Pure Points model provided by Jeff Sagarin is included in this report.
Schedules, Spreads & Win Probabilities
So, with that, it’s on to a multiple ratings analysis. The focus is on the all-important in-conference slate so as to better illuminate the prospects for each of the teams to make it to the B1GCG in Indy, and beyond. But before delving into the details of applying the ratings to the schedules, let’s first have a look at the ratings themselves across the conference. All three ratings are points-based, but only S&P+ and FPI are relative to an average FBS team.
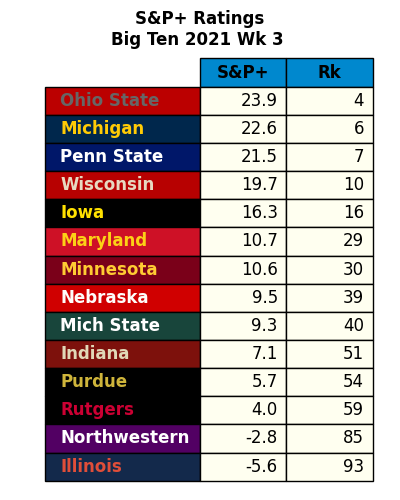


What you might notice is that as of this week, the only consistent placements are OSU at the top, and the two teams with negative, below-average ratings: Northwestern and Illinois. Indeed, OSU even maintains the same ranking, #4, across all three rating systems. Likewise, the resurgent Wolverines pull triple #6’s to keep pace with the Buckeyes, superceded only by the #5 ranking of Iowa in the Sagarin list. That’s not to say there’s complete consistency among the ratings. That would make things too simple! Outside OSU, Northwestern and Illinois, the rank order variation of teams within the conference across the board range from one place (Michigan, Penn State, Nebraska) to as many as six places (Maryland).
B1G East Schedule Rundown
The tables below are composites of the conference schedules for all seven teams in the B1G East with the latest ratings following the games week 3. The last table in each set simply shows a rank-ordering of the B1GE teams based on their expected in-conference win totals - it’s not a projection of divisional standings based on projected wins, losses, and tie-breakers. Those are found in a later section.
S&P+ Results

With the Hoosiers’ opening week drubbing at the hands of Iow, the outlook for the remainder of the 2021 season has taken a turn for the worse. What’s more is that the Hoosiers are looking down a scheduling gauntlet that has all of their B1GE divisional opponents in a row, and having to play PSU and UM on the road. As a result, the once-vaunted Hoosiers find themselves at the bottom of the expected wins standings, even below perpetual bottom feeder, LOLRutgerz.
The outlook offered by S&P+ for MSU puts them in the same strata as Maryland, which is an expected win total of 4.3 games that puts them relatively out of B1GE divisional contention, but still within the bowl-eligibility bubble. As such, both teams are expected to have marginally fewer B1G wins than losses, and the game-by-game spreads reinforce that.
Meanwhile, the top three teams in the expected wins standings are the usual suspects: OSU, PSU and UM, in rank order. The separation among the three is only 0.7 wins, with no team being favored in all of its remaining games. OSU is a 1.7 point underdog (45.7% win likelihood or about 5:4 odds) in one of its games… the one at the end of its schedule. Likewise, PSU is the underdog in a single game, when it travels to Columbus. Meanwhile, UM is the underdog in two of its games, both on the road. The first at Wisconsin (by a 0.1 point margin); the other, at Penn State (1.9 points). Suffice it to say with so much football yet to be played in such a competitive landscape, anything can happen.
FPI Results

FPI largely follows suit with S&P+ in regard to the expected wins standings. The Hoosiers find themselves at the bottom, nearly a full win behind 5th place Rutgers, with Maryland in between them. It appears FPI is showing Sparty a little more love than S&P+, still putting them in the #4 spot, but with 5.5 expected wins which nudges them into the upper tier of contenders for the B1GE divisional title. The remaining contenders are led by OSU with 6.9 expected wins, followed by UM 0.6 wins back, and Penn State at about 6.1 expected wins. So much like S&P+, the separation in expected wins among the top 3 teams is about 0.8 wins per FPI. When including MSU, it expands to about 1.4. Also like S&P+, FPI has no team favored in all of its remaining games. Quite coincidentally, FPI also shows OSU as a 1.7 point underdog in only one of its games… the one at the end of its schedule. Michigan is very close to being favored in all of its remaining games, but alas, is a 0.1 point underdog to the Nits in Happy Valley. Meanwhile, the Nits themselves are the underdog in two other games, when they visit Kinnick Stadium on October 9 (0.8 points) and somewhat stunningly when they visit Spartan Stadium at the end of their schedule (0.4 points).
Sagarin Results
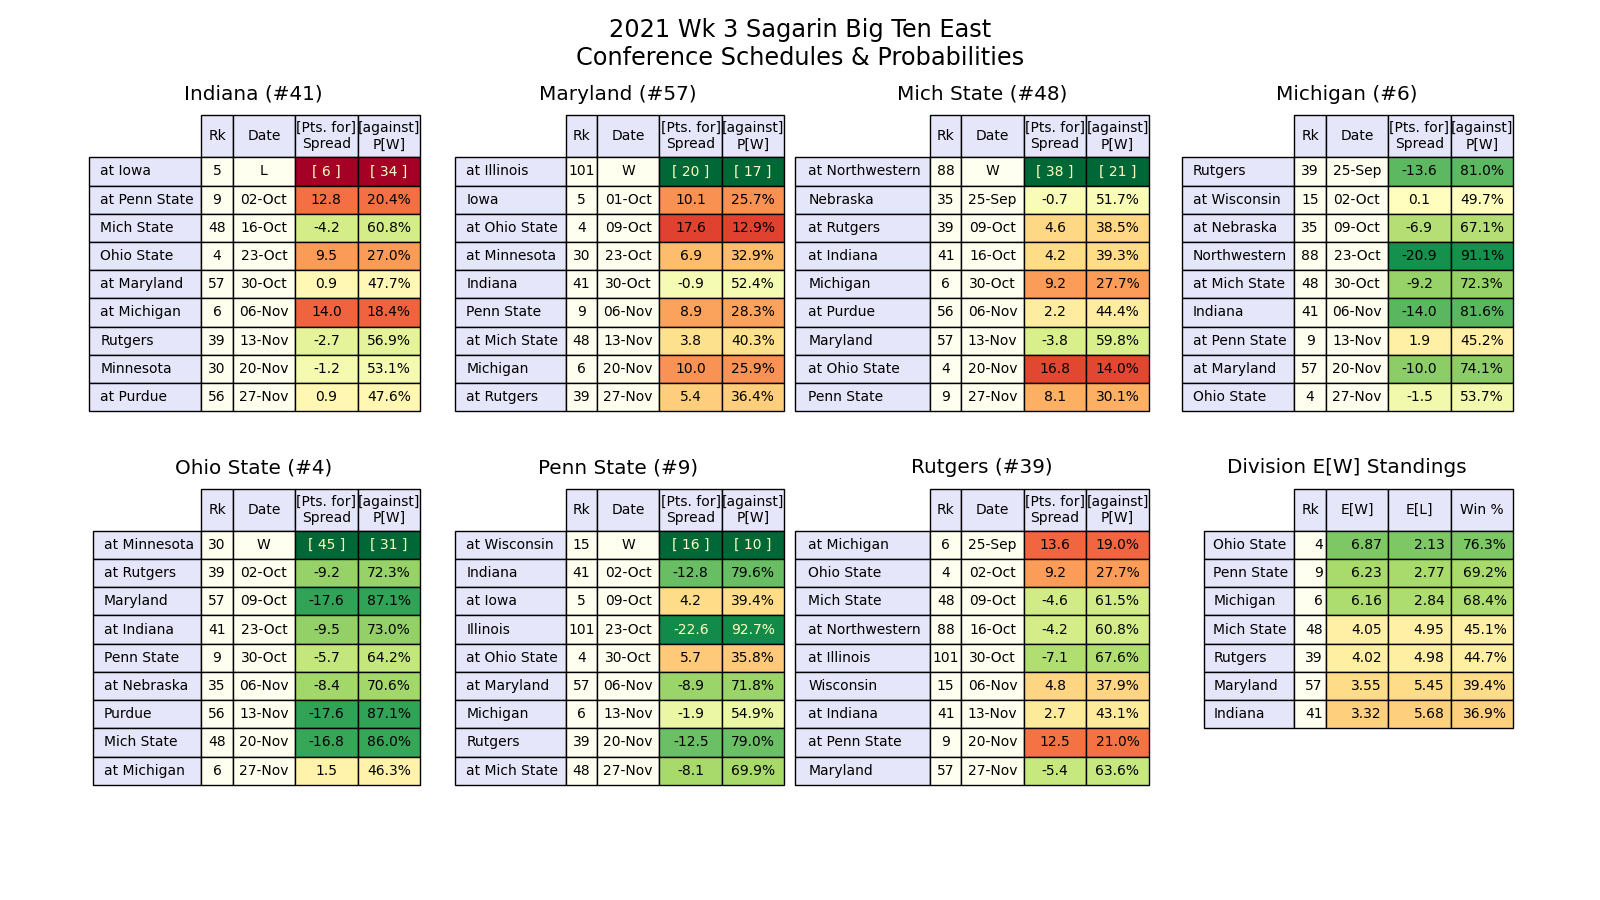
The Sagarin ratings are largely in agreement with the S&P+ and FPI results in so far as the Hoosiers are the projected bottom dwellers, supplanting the resurgent Black Knights. The Hoosiers may be left on the outside looking in when it comes to bowl eligibility on account of its having an OOC loss on the books. The other three teams (MSU, Rutgers & Maryland) have a shot at an undefeated OOC and thereby maintain their position in the bowl eligibility bubble.
The remaining contenders are the usual suspects, led by OSU with 6.9 expected wins, followed by PSU 0.6 wins back, and UM at about 6.2 expected wins. So much like the other ratings, the separation among the top 3 teams is about 0.7 wins per Sagarin. Sagarin as well has no team favored in all of its remaining games. Sagarin also has OSU as a 1.5 point underdog in only one of its games… the one at the end of its schedule. Beyond that, some subtle differences in the Sagarin ratings are enough to impact the projected outcomes of a couple significant games. Michigan is a 0.1 point underdog to the Badgers at Camp Randall, and a 1.9 point underdog to the Nits in Happy Valley. The Nits as well turn out to be an underdog in two of their remaining games, by 4.2 points when they visit Kinnick Stadium on October 9, and by 5.7 points when they visit the Horseshoe.
B1G West Schedule Rundown
The next set of schedule tables shows the conference schedules for all seven teams in the B1G West based week 3 results and ratings for the remaining games from S&P+, FPI and Jeff Sagarin’s Pure Points ratings. Again, the last table in each figure simply shows a rank-ordering of the B1GW teams based on their expected win totals - it’s not a projection of divisional conference standings per se. Those projections can be found in the last section.
S&P+ Results

The S&P+ ratings in the B1G West show that the race to Indy is essentially between two contenders: Iowa and Wisconsin. Iowa leads the division with about 6.3 expected wins, but the Badgers are close on their heels only 0.4 expected wins back. What’s more, the Badgers are favored by a whopping -6.4 point margin (2:1 odds) when the Hawkeyes come to visit Camp Randall on October 30. This would put the Badgers in the catbird seat were it not for the slim margin when they play host to Michigan 3 weeks earlier. Clearly, the Michigan game will make or break Wisconsin’s season going into the Iowa matchup, as they now have no margin for error after dropping their opener to PSU. As for the rest of the B1GW at this point, Minnesota is well positioned in the Bowl-eligibility Bubble, but being an underdog to both Iowa and Wisconsin puts them on the outside looking in as far as contending for the division title goes. Purdue and Nebraska both have a difficult road back to bowl eligibility, while Illinois and Northwestern are in a race to the bottom of the standings, with NU leading in that direction.
FPI Results

In contrast to S&P+, the FPI ratings in the B1G West show Iowa as the clear leader at 6.3 expected wins, 1.4 wins ahead of Wisconsin. Like S&P+, FPI also sees the Badgers as the favorite over the Hawkeyes, but by a much slimmer -1.4 point margin (5:4 odds). What’s more, the Badgers are also the underdog (3.7 point margin, or 2:3 odds) when they play host to Michigan. At this point, the B1GW Bowl-eligibility Bubble as per FPI is led by Purdue, followed by Minnesota and Nebraska, with the former two on a glide path to 6 wins. The Huskers, however, will need to scrape out an unexpected win somewhere along their schedule. At about 3.5 expected wins, the chances for the Huskers to make it to a bowl are 50/50. Meanwhile, FPI agrees with S&P+ insofar as Illinois and Northwestern are in a race to the bottom of the standings, with NU in the lead.
Sagarin Results

The Sagarin ratings also show Iowa as the clear leader in the B1GW at 6.9 expected wins, 1.6 wins ahead of Wisconsin. In slight contrast to the other ratings, Sagarin sees the Badgers-Hawkeyes matchup as essentially a toss-up: the margin is 0.0 points with a 50.1% win probability for the Badgers! Sagarin also has the slimmest of the 3 margins when the Badgers - but as a 0.1 point favorite - when they play host to Michigan. So what we have is an interesting probabilistic situation in which, despite Wisconsin having a lower expected wins total than Iowa, is still favored in all of its remaining games. The B1GW Bowl-eligibility Bubble as per Sagarin is led by Minnesota, followed by Purdue and Nebraska. Sagarin also suggests that the Huskers - at about 3.5 expected wins - will need to scrape out an unexpected win somewhere along their schedule. Meanwhile, all 3 ratings are in agreement that Northwestern leads Illinois in the race to the bottom of the standings.
Expected Conference Wins Distributions
Before getting into the projected final standings, it’s worth having a look at the distributions of expected wins across the conference. If nothing else, it serves as a reminder that point spreads are subject to very wide statistical variations (two standard deviations is +/- 34 points), wide enough to account for just about anything happening!
The plots below show the expected total conference wins distributions for the teams in each division. The legends list the teams in order of decreasing expected win totals. The expected win total is determined by the value at which half of the area under the curve is to the left, and the other half is to the right! The number of wins with the highest probability (i.e. the most likely outcome) for a given team is referred to as the “mode”.
S&P+ Results
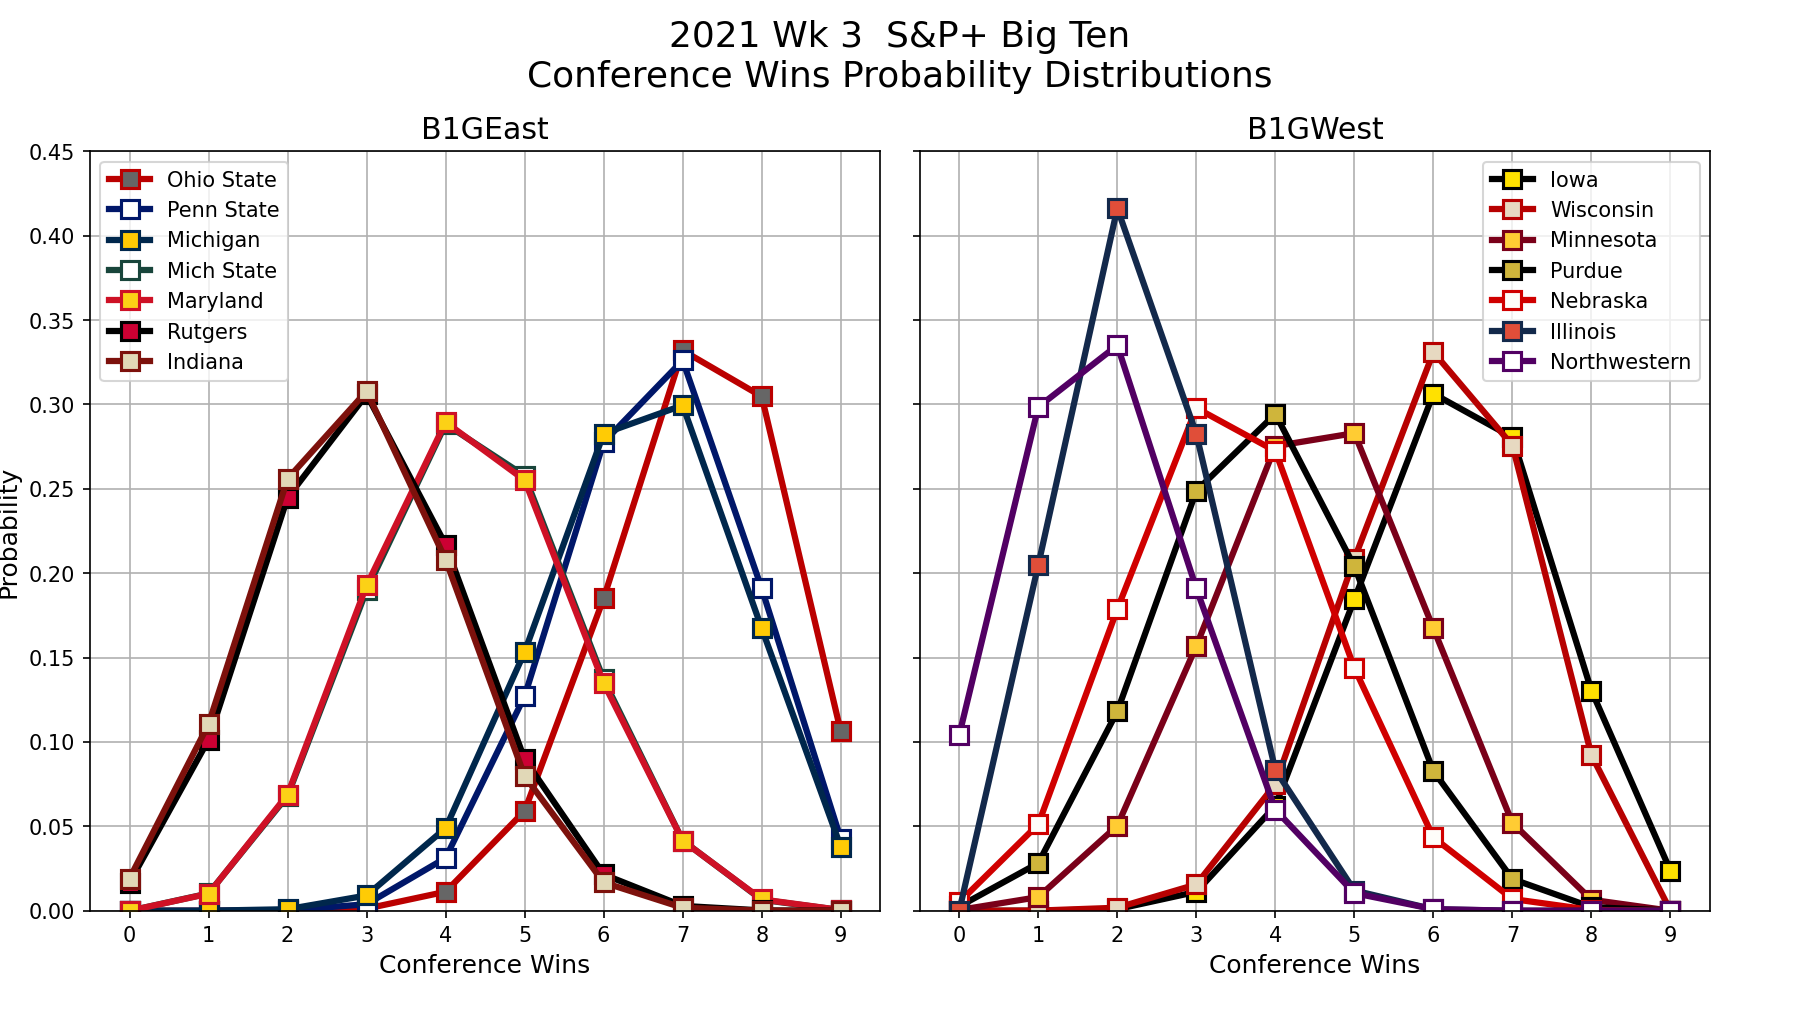
The S&P+ distributions show just how close the contenders are to each other in both divisions. In the B1GE, all three contenders - OSU, PSU and UM - all have modes of 7 wins. The only difference being that OSU distribution has a bias toward 8 wins, while PSU and UM both have biases toward 6 wins. OSU has the best chance of going undefeated in the B1G at just above 10.6%, while PSU and UM are at 4.3% and 3.8%, respectively. On the other side, the competition in the B1GW - though limited to only Wisconsin and Iowa - is even tighter. Both Iowa and Wisconsin have modes of 6 wins each, with nearly identical biases toward 7 wins. Iowa is the only team with a chance of going undefeated in the B1G with a 2.4% chance.
Also clearly delineated are the distributions of the Bowl-eligibility Bubble teams. In the B1GE, the distributions of Maryland and MSU are practically identical (indeed, MSU’s curve is almost completely obscured by Maryland’s, but it’s there!). Nearly the same goes for the B1GE Bottom Feeders: LOLRutgerz and Indiana. The B1GW Bubble teams are more widely distributed, with each having uniques modes: the Gophers at 5 wins, the Boilers at 4 wins, and the Huskers at 3 wins. As for the Bottom Feeders, the Cats and Illini are pining for the fjords with modes of 2 wins apiece.
FPI Results

The FPI results are markedly less equivocal in separating the wheat from the chaff, the curds from the whey, or the “golden pants” from the skidmarked BVD’s. The B1GE chart shows four contenders in a loose grouping aligned on the 6-win and 7-win modes. OSU is the sole team with a 7-win mode, whereas MSU, PSU and UM all have 6-win modes. The differences being that MSU’s distribution is biased toward 5 wins, PSU is centered on 6 wins, and UM has strong bias toward 7 wins. OSU has the best chance of going undefeated in the B1G at 7.6%, followed by UM at 3.3% and PSU at 1.7%. MSU’s chances are vanishingly small. On the other side, Iowa is the clear favorite since Wisconsin already has a B1G loss on its record. The Hawkeyes are sitting pretty, albeit with a mode of 6 wins biased strongly toward 7 wins. In fact, the Iowa distribution is nearly identical to UM’s. Meanwhile, Wisconsin is balanced on a 5-win mode.
Less clearly delineated in the FPI results are the distributions of the Bowl-eligibility Bubble teams. In the B1GE, the Maryland-Rutgers matchup may be the one that bursts the bubble for the loser. Indiana, though having the same 3-win mode as Maryland, is biased toward only 2 B1G wins, and will need to count on winning its remaining OOC game to become bowl eligible. Two of the three B1GW Bubble teams - Minny and Purdue - are tightly grouped and balanced with 4-win modes, while the Huskers show a 3-win mode with a strong bias toward 4 wins. Meanwhile, as with the S&P+ results, the Cats and Illini are pushing up the daisies with modes of 2 wins apiece.
Sagarin Results

The Sagarin results look somewhat similar to the S&P+ results, at least as far as the B1GE is concerned, with the exception that among the three contenders - OSU, PSU and UM - OSU is set apart with a mode of 7 wins, whereas PSU and UM are relegated to a 6-win mode, yet both with strong biases toward 7 wins. On the other side, Iowa is once again the clear favorite, alone with a 7 win mode compared to Wisconsin’s upward tilting 5-win mode.
This time in the B1GE, it’s MSU and Rutgers whose distributions are nearly indistinguishable in the Bowl Bubble region, while Maryland and Indiana take up the positions of the Bottom Feeders. In the B1GW, Purdue and Minnesota are jumbled around the 4-win mode, with Nebraska leaning toward it from a 3-win mode. Meanwhile, the Cats and Illini have very prominent 2-win modes, which only means they’re less likely to bust out of it.
B1G Expected Final Standings
As alluded to above, following are projections of the divisional conference standings at the end of the season based on the combination of current records and the projected wins and losses for the remainder of the season.

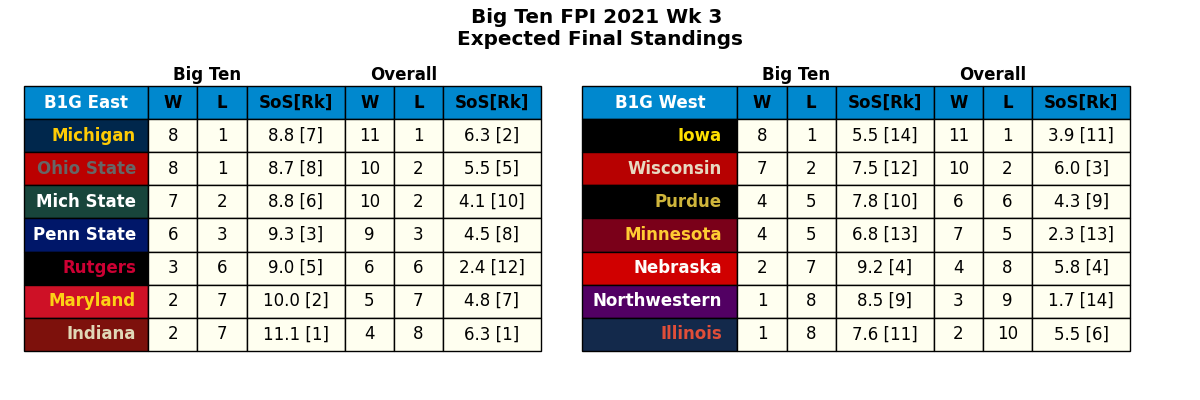
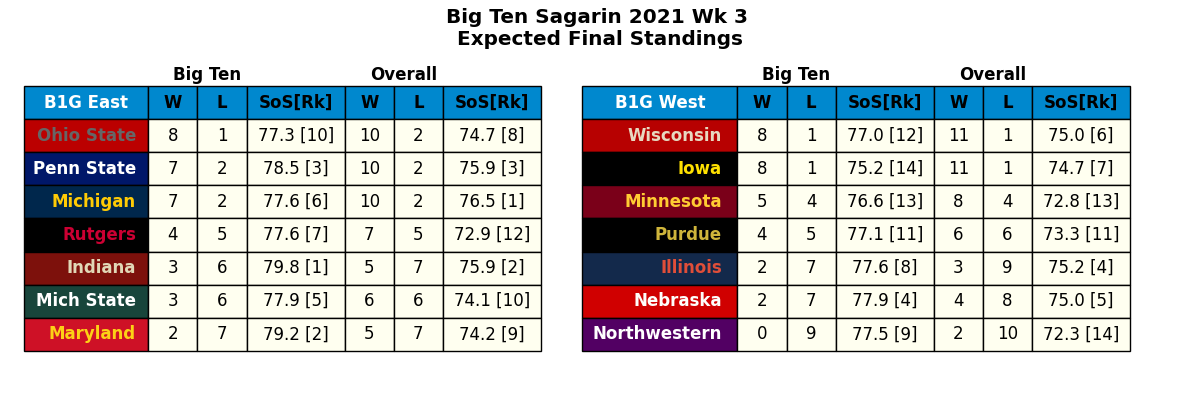
Based on simple point-margin enforced wins and losses, the FPI ratings forecast Michigan to win the B1GE with an 8-1 conference record, while S&P+ and Sagarin hold that OSU wins the B1GE, also with an 8-1 record. Quite surprisingly, The Game does not look to be the determining event in the B1GE according to all three ratings. Indeed, they all project Michigan as the favorite of OSU in Ann Arbor. Likewise, all three project PSU as the favorite over Michigan in Happy Valley. Instead it’s the matchup between Michigan and Wisconsin that turns out to be the deciding factor in UM’s B1GCG fate, and the only rating that projects Michigan to defeat Wisconsin is ESPN’s Football Power Index.
As for the B1GW, all three ratings project the champion to have an 8-1 record. But the results are in a sense complementary to those of the B1GE. When OSU is projected champion of the B1GE, Wisconsin is projected champion of the B1GW. Conversely, where Michigan is projected champion of the B1GE, Iowa is champion of the B1GW. The reason once again hinges on the results of the Michigan-Wisconsin game. The winner of this game is more likely to become the champion of their respective division, while the loser will be relegated to finish 2nd (in Iowa’s case) or 3rd (in Michigan’s case) in their division!
Yours in football, and Go Blue!
September 24th, 2021 at 9:51 AM ^
Do any or all of these include preseason expectations rather than just 2021 results to date? Last year was clearly not a good guidepost for pointing us at how teams are going to do this year (at least so far, hello-Washington!)
September 24th, 2021 at 10:24 AM ^
Yes, the S&P+ and FPI ratings do include preseason weightings, but obviously at a diminished level from the the actual pre-season. When removing the preseason bias in S&P+, whelp:
I almost never share this because people overreact to it and it has no predictive value, but I CAN'T HELP IT, THIS IS THE WORLD I WANT TO LIVE IN.
SP+ top 5 if all preseason projections were taken out:
1. Michigan
2. Georgia
3. Ole Miss
4. Texas Tech
5. Florida— Bill Connelly (@ESPN_BillC)September 19, 2021
September 24th, 2021 at 10:47 PM ^
Thank you for doing this.
Comments