fun with spreadsheets
Things were lookin’ up for McKeon last year. Is that a thing? [Upchurch]
One of the things I’d like to start tracking better in recruiting data are deltas: how much each player’s crootin numbers move over the course of his recruitment. I’ve been updating my spreadsheets a bunch the last few weeks as the sites put out their final rankings, and I fortuitously backed up the data on New Year’s Day so I have a decent snapshot right now of how much the rankings moved from the end of the season to when the services redid their final rankings for this week.
Unfortunately this doesn’t include the two guys who committed last week, since I grabbed their ratings only when those announcements hit. Wanna see?
RIVALS
| Player | Pos | Stars | RR | Nat Rk | Pos Rk | ☆/5 |
|---|---|---|---|---|---|---|
| Otis Reese | OLB | ☆☆☆☆ | 5.9—>6.0 | 42—>56 | 2 | 4.76 |
| Aidan Hutchinson | WDE—>SDE | ☆☆☆☆ | 5.8—>5.9 | NR—>129 | 17—>8 | 4.58 |
| Myles Sims | CB | ☆☆☆☆ | 5.9 | 79—>103 | 9—>14 | 4.49 |
| Jaylen Mayfield | OT | 3—>4 | 5.6—>5.8 | NR | 31-->17 | 4.25 |
| Cameron McGrone | OLB | ☆☆☆☆ | 5.8 | 238—>195 | 19—>16 | 4.14 |
| Joe Milton | DUAL | ☆☆☆☆ | 5.9—>5.8 | 189—>200 | 11 | 4.04 |
| Mustapha Muhammad | TE | ☆☆☆☆ | 5.8 | NR | 16—>17 | 4.02 |
| Gemon Green | CB | ☆☆☆☆ | 5.8 | NR | 37—>39 | 3.91 |
| Christian Turner | RB | ☆☆☆ | 5.7 | NR | 18 | 3.90 |
| Taylor Upshaw | SDE | ☆☆☆ | 5.7 | NR | 24—>25 | 3.85 |
| Ben VanSumeren | ATH | ☆☆☆ | 5.7 | NR | 37—>34 | 3.81 |
| Vincent Gray | CB | ☆☆☆ | 5.7 | NR | 56—>60 | 3.70 |
| Sammy Faustin | CB | ☆☆☆ | 5.7 | NR | 58—>62 | 3.69 |
| Ryan Hayes | OT | ☆☆☆ | 5.6 | NR | 47 | 3.62 |
| Kevin Doyle | PRO | ☆☆☆ | 5.6 | NR | 24 | 3.60 |
| Hassan Haskins | RB | ☆☆☆ | 5.6 | NR | 41 | 3.60 |
| Luke Schoonmaker | TE | ☆☆☆ | 5.6 | NR | 36 | 3.52 |
| Michael Barrett | ATH | ☆☆☆ | 5.6 | NR | NR | 3.35 |
| Julius Welschof | SDE | ☆☆☆ | 5.5 | NR | NR | 3.00 |
| German Green | S | ☆☆☆ | 5.5 | NR | NR | 3.00 |
| Ronnie Bell | WR | ☆☆ | 5.4 | NR | NR | 2.95 |
First a few words on what we’re looking at and how to react to things. The “☆/5” is my own conversion of the ratings and position rankings the sites provide so I can judge them all against each other. It’s imperfect.
Don’t pay attention to small changes in rankings, and the further down they start the larger delta you need to discount. That’s an effect of other guys shooting up the rankings and pushing everybody below them down a bit, not a new opinion on our guy. This is normal and happens every year. You’ll note Rivals didn’t make a lot of changes among their three-stars but fiddles with the guys in the top of the rankings a lot, part of a larger tendency to focus on the headline-grabbers.
Rivals, like the other services, starts stingier with their 4- and 5-star ratings to leave room for the inevitable risers. You can prove this yourself: go on the Rivals database and count how many guys in the 2019 class have a 6.1 (five stars) or 6.0 (highest four-stars). It’s 12 and 35—half as many as any year prior. Rest assured that’ll be more like 25-30 in the 6.1 range and 70-80 who get 6.0s by this time next year. That’s how Otis Reese jumped to a 6.0 while slipping 14 spots in the national rankings—what that means is he didn’t move while data on other guys filled in around him.
[Hit THE JUMP to see where everyone moved]
We’re off the shores of offseason and wading toward the Signing Day drop-off, and 247 recently released their final 2018 rankings, so I thought now would be a good time to update my big, useful roster database.
apologies for giving Rutgers a competitive advantage
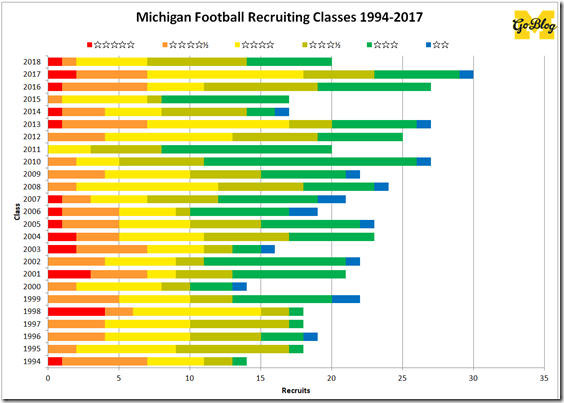
It can tell you fun things, like how this year’s recruiting class stacks up against previous ones:
(it’s like the 2014 one, ratings-wise)
…or the NFL outcome of Michigan recruits by their relative star ratings:
| As Recruit | Players | Rnds 1-3 | Rnds 4-7 | UDFA+ | UDFA | No NFL |
|---|---|---|---|---|---|---|
| ☆☆☆☆☆ | 17 | 9 (53%) | 2 (12%) | 1 (6%) | 2 (12%) | 3 (18%) |
| ☆☆☆☆½ | 64 | 9 (14%) | 12 (19%) | 3 (5%) | 9 (14%) | 31 (48%) |
| ☆☆☆☆ | 110 | 17 (15%) | 16 (15%) | - | 1 (1%) | 76 (69%) |
| ☆☆☆½ | 85 | 2 (2%) | 7 (8%) | - | 1 (1%) | 75 (88%) |
| ☆☆☆ | 113 | 4 (4%) | 7 (6%) | 1 (1%) | - | 101 (89%) |
| ☆☆ | 14 | - | - | 1 (7%) | - | 13 (93%) |
| Walk-on | 26 | 1 (4%) | 1 (4%) | - | - | 24 (92%) |
Or how attrition is going:
(it has stayed relatively low compared to Rodriguez and Carr)
(few players are leaving without degrees)
If you download and play around a bit you can quickly find things like which players each recruiting service adored/didn’t think much of relative to each other:
| Rivals | Scout | ESPN | 247 | |
|---|---|---|---|---|
| Loved
| Steve Breaston | Paul Sarantos | Marques Walton | Benjamin St-Juste |
| Conelius Jones | Austin White | Rueben Riley | Cameron McGrone | |
| Kevin Koger | Andrew Stueber | Junior Hemingway | Nate Johnson | |
| Jeremy Gallon | De'Veon Smith | Ja'Raymond Hall | Oliver Martin | |
| Alex Mitchell | Patrick Omameh | Isaiah Bell | Jaylen Mayfield | |
| Hated
| Ja'Raymond Hall | Kingston Davis | Kevin Koger | Austin White |
| Andrew Stueber | Alex Mitchell | Brandon Smith | Conelius Jones | |
| Brandon Watson | Keith Washington | Dennis Norfleet | Brad Robbins | |
| Paul Sarantos | Gabe Watson | Boubacar Cissoko | Myles Sims | |
| Ronnie Bell | Reuben Jones | Rocko Khoury | Zach Gentry |
--------------------------------
Direct Recruiting Comparisons
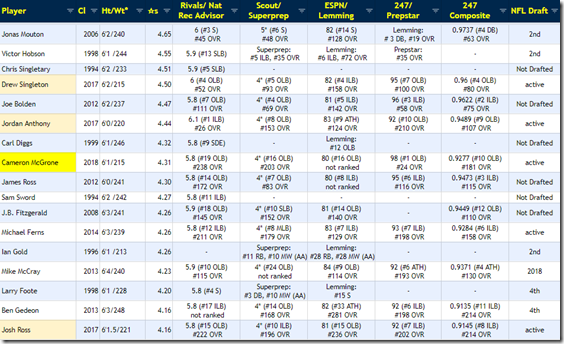
There’s also a second table that shows all of the recruiting data that went into my composite rankings, if you want to quickly compare where the sites put Luke Schoonmaker to Sean McKeon (they’re nearly identical):
…or place Cam McGrone among Michigan’s all-time linebacker recruits:
…or settle an argument with the guy who said Mike Hart was “just a three-star”:
(he was only barely)
…or just pull up a quick list of who’s eligible for this year’s NFL draft. I mostly use it to put the new recruits in context. Like it’s good to know Christian Turner is basically tied with Chris Evans, that Aidan Hutchinson ended up almost exactly where Ryan Van Bergen was rated, and that Jarrod Wilson and Gemon Green wound up right where Benjamin St-Juste did (German Green is down in the JT Floyd/Courtney Avery/James Rogers region). Seeing a handful of former players whose careers (and ceilings) I’m familiar with is more helpful to placing a croot than where he stands among the thousands of high schoolers of his own year whom I haven’t seen.
--------------------------------
Starter Data
Lastly I updated the starter data with 2017 starts, which by the way featured a lot of stuff like three tight ends or three fullbacks. Those atypical start formations are more helpful than hurtful—it’s accurate to say that Gentry and McKeon were more active in the passing game, for example, than Eddie McDoom or Nate Schoenle.
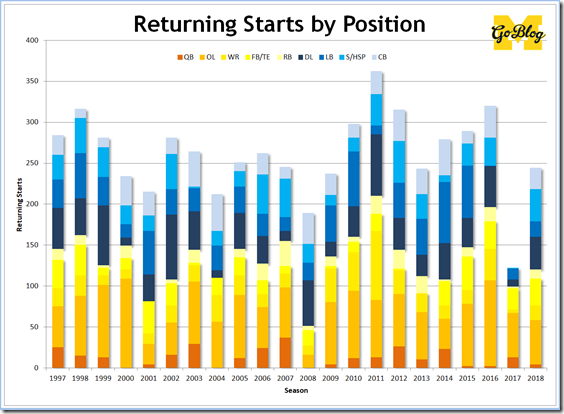
You may remember last year was a crazy low bar for starts returning. Things are getting back to normal. Rather than a historically green team Michigan will have a slightly below averagely experienced team:
The big difference you can’t see here is the distribution of OL starts: last year almost all of the returning OL experience was concentrated in one guy; this year it’s spread out among six dudes: Bredeson, Ruiz, Onwenu, JBB, Ulizio, and Runyan.
The last bit highlights a flaw in reading returning starts without context: there aren’t many years in trackable Michigan history in which any of those guys would have gotten extensive playing time. It also hides regular contributors who didn’t technically start—2016 Maurice Hurst being the case example.
Digging down to game-by-game start data gives us a clearer, albeit imperfect, sample of what was on the field. And last year—to the surprise of nobody—it was historically young.
Let’s put those bars in context: the average starter for Michigan last year on both units was younger than a redshirt sophomore. Only twice in the last 20 years did any one unit dip below that mark: the 2008 offense, and the 2009 defense. I’m sure I don’t have to remind you how that went.
The bad news here is the offense at least is in for another year of historical youngness, quite likely falling below even this year. I plugged the following projection of 2018 starts: Patterson (13), Evans (6), Higdon (7), Mason (8), McKeon (11), Wheatley (2), Gentry (7), Eubanks (1), Black (10), DPJ (8), Crawford (1), and an OL of Newsome-Bredeson-Ruiz-Onwenu-Hudson, and it came out at an average year in program of 2.67, barely above 2008.
Does it matter? With the exception of 1997, the peak years do seem to correlate to the teams playing the guys who’ve been around awhile: 1999, 2002, 2003, 2006, 2011, 2012, and 2016. On the other hand Ohio State managed to put up a strong offense in 2016 despite a similarly young roster, though it should be noted they were operating under an experience QB and the young players were holes that got exploited by better teams.
(I never know what to do here with transfers who’ve started at previous stops. Considering the performance of said transfers when they have played, the most accurate thing to do is to just throw that data out—after all they’re new to the system.)
The other interesting thing I can do with starter data is to check personnel shifts. In the past I used it to show the relative mass on the field between coaches. But the Harbaughification of the offense is clear in other ways, like starting more tight ends:
| AVG Skill Position Personnel at First Snap | ||||
|---|---|---|---|---|
| Season(s) | RBs | FBs | TEs | WRs |
| Carr | 0.99 | 0.62 | 1.27 | 2.11 |
| Rodriguez | 1.22 | 0.14 | 0.78 | 2.86 |
| Hoke | 0.98 | 0.45 | 1.12 | 2.45 |
| 2015 | 1.02 | 0.94 | 1.09 | 1.95 |
| 2016 | 1.00 | 0.69 | 1.77 | 1.54 |
| 2017 | 0.92 | 0.77 | 1.92 | 1.38 |
Anyway if you want to download your own copy of my data and play with it, you’re welcome to it. Just share your findings in the diaries.


25