A New Madness to March: Creating a Bracket Optimization Model (Part Three)

TL;DR - For the last 10 years, I've built a bracket optimization model to maximize my odds of winning March Madness pools. For the last few years, I've made it available to the fine folks here at MGoBlog. Email me at [email protected] or drop a comment below if you are interested in using it.
Happy Madness. I'm excited to make my model available once again, while also adding a few more bells and whistles. As a refresher, here are links to past years' diaries:
- Part One - A deep dive into how the model works.
- Part Two - A brief summary of how the model works, plus improvements made to last year's edition.
As a post-mortem of how the model fared for me last year, my nine brackets (yes, nine - I'm not really a gambler but investing as much time as I have into this I want to put the model to sufficient use) finished in the following percentiles of brackets submitted to ESPN: 99.3%, 97.2%, 94.7%, 91.1%, 88.2%, 85.2%, 81%, 81%, 78.4%.
Four of nine in the top 90%, and eight of nine in the top 80%. Not too shabby. But last year, I'm on the record for saying the four teams I really liked as favorable picks were Houston, UCLA, Tennessee, and UConn. UConn ended up being a great call; however, you may remember that Houston, UCLA, and Tennessee were all teams that suffered significant injuries leading into the Big Dance.
Thus, the inspiration for one of this year's additions to the model. This is very much still experimental, subjective, and more art than science; but I've attempted to quantify the overall quality of teams' stars and rotations as well as the total impact on their rosters due to injuries using offensive and defensive Porpagatu! - an advanced points-over-replacement statistic developed by Bart Torvik (and used by Seth in basketball preview lineup cards). The math I use is pretty rudimentary and relies on only three categories (probable, questionable, out) for player status, but it does yield some interesting results. An excerpt from last year's tournament:
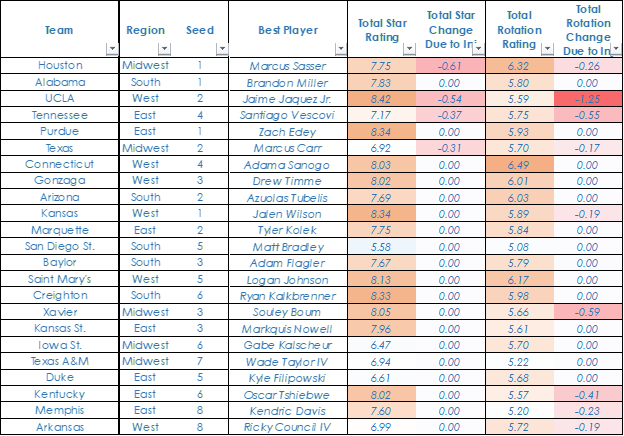
The "Star" rating takes the average combined offensive and defensive Porpagatu! for a team's top three players, while the "Rotation" rating applies the same statistics for a team's top seven players. Last year, UCLA's injuries (Jaylen Clark - out; Adem Bona - questionable) heading into the tournament were the difference between both its Star and Rotation ratings being alone in first place (UCLA's star rating still remained in first on the backs of Jaime Jacquez Jr, Tyger Campbell, and David Singleton; but their rotation rating dropped from first to 25th among tournament teams). Houston (with Marcus Sasser even listed as probable) and Tennessee (without Zakai Zeigler) heading into the tournament also had very material impacts on their roster ratings, and these adjustments due to injury may have warranted heavier fading of those teams.
Retroactively applying these ratings to last year's tournament results:
- Teams with the greater Star rating won 61.9% of games.
- Teams with the greater Rotation rating won 69.8% of games.
- Teams with both the greater Star and Rotation ratings won 68.5% of games.
As a comparison, the favorites (according to the Kenpom/Torvik/BPI ensemble model) won 69.8% of games last year. Small sample size and all that, but there may be some justification to sprinkle in some subjective analysis in this year's picks. This year's key injuries (Marquette's Tyler Kolek, Kansas' Hunter Dickinson and Kevin McCullar, Duke's Caleb Foster, Baylor's Langston Love) appear to be a little less catastrophic than 2023's injuries; but it will be interesting to see how those teams fare relative to expectations based on the advanced team rating systems.
The next addition to the model is likely only relevant to those who plan to make multiple brackets and use the "Pools" tab of the model. I am now quantifying the relative allocations I have to each team based on actual selections that are made and recorded in the "Pools" tab. The higher the number, the higher the relative allocation is and the more susceptible my brackets are to a particular team losing (i.e. a "bracket buster").
This serves as a tool for measuring when it may be necessary to adjust picks and perhaps sprinkle in some diversification. I use two statistics:
- Probability Quotient: the frequency or percentage of time that a team is selected across my bracket entries / that team's probability to reach the corresponding round.
- E[PAP] Quotient: the frequency or percentage of time that a team is selected across my bracket entries / that team's E[PAP] for the round compared to all alternatives for the round.
Below is an excerpt of my picks from last year. While I did mull over plenty of high-leverage picks for my Champion, Final 4, Elite 8, etc.; I do realize now that there were several instances where I didn't vary my picks so much as I maybe should have. A few outliers from last year (combining both the probability and E[PAP] quotients together):
- Marquette to the Elite 8
- Arizona to the Elite 8
- Texas to the Elite 8
- Kansas to the Sweet 16
- Alabama to the Final 4
- Indiana to the Sweet 16
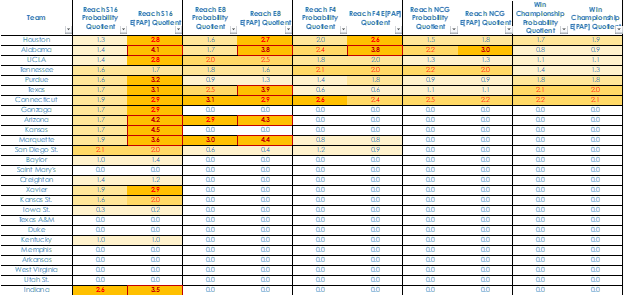
Obviously, it's easy in retrospect to have buyer's remorse over my selections from last year's tournament, but it is interesting that five of the six scenarios in which I had the highest relative allocations did not happen. I may have been well-justified in adding more Kansas State's, Creighton's, San Diego State's, and Miami FL's. This methodology should help serve as a way to quantify when/if diversification may be necessary before finalizing selections.
That about does it for this year's new and improved edition of the model, and I'm now diligently working on incorporating the new data for this year's tournament. As always, shoot me an email or leave a comment if you are interested.
Best of luck with your pickings!
-mgoDAB
FYI - It seems as though ESPN has discontinued their “Who Picked Whom” page, which provided comprehensive public selection data. That is both unfortunate and annoying, as this data is a crucial component of the model. It seems that CBS and Yahoo! may offer alternatives for the data that I can use, which is good. But if anyone can offer help/insight with regard to this issue, I’d be very appreciative!
I see a "People's Bracket" on ESPN. Is that what you used previously?
https://fantasy.espn.com/games/tournament-challenge-bracket-2024/peoplesbracket
Not the same thing unfortunately. Who Picked Whom was a comprehensive dataset that displayed every team round-by-round. It looks like they replaced that with just showing the data for the champion selections.
There are some rumors on the interwebs that ESPN will publish it in the next day or so. Hoping that’s true. But if not, I’ll be able to manage with the data that is currently available on ESPN, Yahoo!, and CBS.
CBS has them on the app at the very least
Unfortunately the CBS interface makes it impossible to retrieve the data in a timely manner, needing to click through every possible matchup scenario to get all the data. That’s my experience at least…if I’m mistaken and there’s a comprehensive page that displays all the data in one place, please let me know!
But I’ve been able to make due. I’ve been extrapolating the Yahoo data while using Excel Solver and some other interesting math concepts to project an ESPN “who picked whom” with the data that is readily accessible (which is only the champion and first round selections). There’s such a wide discrepancy between Yahoo and ESPN (UConn is 34% and 24% to win on those sites, respectively). I’m using an average of those two datasets.
March 18th, 2024 at 10:35 AM ^
Emailed you, i'm interested in checking it out!
I’d love to get a copy of your spreadsheet. Sent an email.
I'm not going to argue with the mathematical/algorithmic approach ---- this is a VERY GOOD way to ensure that a bracket will end up in, at worst, the top 25% amongst all entries into a pool. I do like it.
However, to actually WIN a pool, you usually need to finish in (at least) the top 2% of all entries. 95th percentile may as well be 5th percentile - they both don't pay out.
So as a further refinement ... I'd suggest strategically/intuitively picking 1-2 outlier things (from 2023, those would be, as you noted, teams like SDSU, Creighton and Miami advancing further) after your mathematical/algorithmic approach. And then hoping they hit.
I think that top 2% threshold is true for larger pools, but for smaller pools (for example, a work or family pool) you can definitely place in the money being in the top 5%-10%. Hell, the winner of my work pool last year finished in only the top 15% (no one picked UConn).
As far as strategically picking outliers, that's entirely what the model is designed to do, and I've written about it in past diaries. Using the advanced team ratings systems paired with public selection data and running simulations for competing bracket entries for various pool sizes, the model specifically helps identify those outlier picks that are statistically justified in improving your odds of winning pools. As a case study from last year:
- San Diego St. to the Sweet 16, Elite 8, and Final 4
- UConn to the Elite 8, Final 4, and beyond
- Tennessee over Duke to reach the Sweet 16
- Creighton over Baylor to reach the Sweet 16
Those are examples of actual picks that I made across my bracket entries where going against the grain was significantly in my favor. Not just in retrospect (because obviously those ended up being the actual results) but because they were statistically justified picks before the tournament even started. The point of the new relative allocation functionality of the model is to help even more in this regard. In last year's case, there would have been even more support to mix things up in earlier rounds with chalking Arizona and Marquette to the Elite 8 being the most egregious examples.
Sounds interesting; emailed!
From what I can tell, the algorithm likes a very chalky South and Midwest.
Chalky indeed, especially the South region with Houston having a >50% chance making it to the Final 4, Marquette dealing with injuries, and Kentucky being a heavy betting favorite relative to expectations. Going to be difficult to justify having anyone but Houston coming out of the region. Texas Tech > Kentucky and Florida/Colorado (if they win their play-in) > Marquette might be some juicy picks I use in my pools. Colorado in particular if they get past Boise has one of the best players in the country in KJ Simpson. The Buffs rank 6th and 8th for my roster Star and Rotation ratings, respectively, for the tournament field.
The Midwest is a bit more interesting with Tennessee and Creighton being viable teams to make the F4 in addition to Purdue (all have >15% shot). Gonzaga/Kansas is a real toss up too.
But yeah, the East and West regions might be the real money makers with UConn and UNC being such heavy betting favorites.
March 20th, 2024 at 11:29 AM ^
Yeah in the midwest, I think the public will be down on Purdue after what happened last year. And I actually agree because I don't think Painter is a good tournament coach. So they will be picked less than the metrics say they should.
March 20th, 2024 at 11:57 AM ^
That’s what I would have suspected too. I was hoping that Purdue would be an intriguing Virginia 2019-type pick with everyone writing them off after what happened last year. But Purdue is actually the third most favored team to win by the public, according to both Yahoo! and ESPN. Wild!
I'm interested!
Shoot me an email if you haven’t already.
sorry for accidental triple comment
sorry, accidental triple comment
Comments